
Getting Started
Monitor and manage your data center from anywhere with the Command Center.
The Command Center is a powerful tool to view, monitor, and manage your data center remotely. All of your infrastructure, digital and colocation in one place. Head to portal.cyxtera.com to get started and sign in to your account with your existing credentials.
Watch the video below for a quick, seven minute introduction to Cyxtera Command Center or keep following the guide below.
Navigating the app
The app’s nav bar on the left is always present. Hovering on the navigation reveals the names of each of the navigation items.
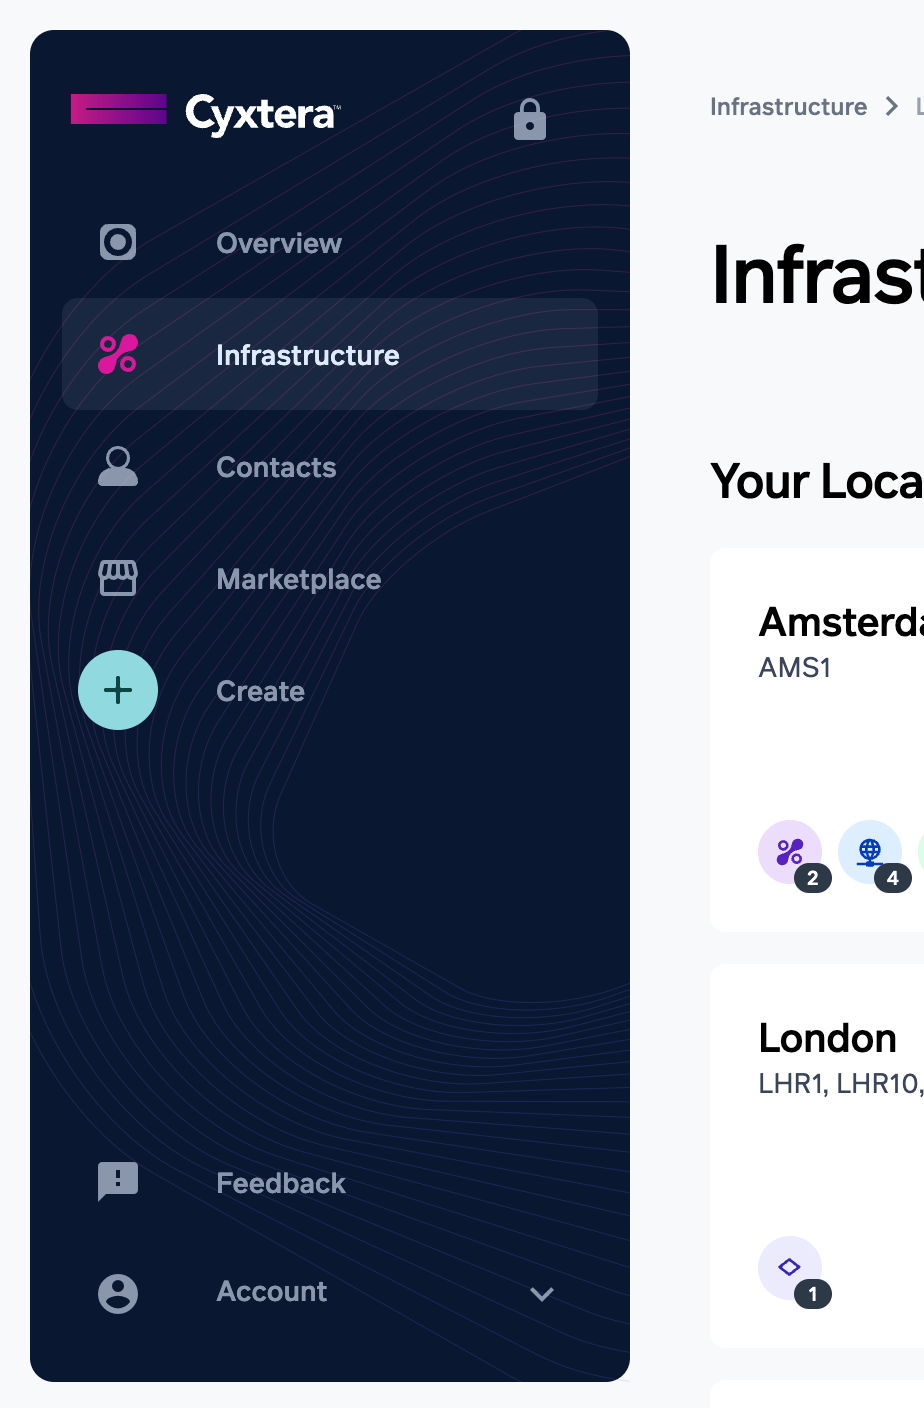
Overview is the home page of the app and includes Orders, Tickets, and Billing information.
Infrastructure is the place to view your colocation and Digital Exchange assets. Selecting a metro navigates to the dashboard for that location.
Contacts is the place to manage your contacts, data center access authorizations, and visitor logs.
Marketplace navigates to marketplace.cyxtera.com where providers within Cyxtera’s ecosystem can be found.
Account Overview Dashboard

The account overview page displays several widgets all containing account-level information. This is the place to find orders, remote hands tickets, support cases, and billing information. The widgets on this page include:
- Cyxtera locations where you have active colocation or Digital Exchange service
- An overview widget highlighting Orders, Tickets, Change records, and Billing (Invoices, Payments, and Adjustments)
- Power usage by data center (may include multiple cages, secure cabinets)
- Shipments in storage
- Reports
Metro Dashboard
Each Metro Dashboard provides details about your environment and assets in that data center including:
-
Overview
- Grid of cages
- Table of standalone secure cabinets.
- Digital Exchange services.
- Metrics including Power utilization over the past seven days or previous month and IP Connect Bandwidth usage.
- Shipments expected inbound and outbound from the data center as well as items in storage.
- Marketplace storefronts with services in the data center
-
Connectivity:
- Providers: Marketplace storefronts with services in the data center
- Cyxtera Network Panels: Displays network panels with connectivity to our Meet-me Room, including Ecosystem Connect.
- Interconnections: Table of Cross Connects and other interconnection products within the data center.
- Digital Exchange Connections: View and manage Digital Cross Connect, Cloud Connect, and Metro-to-Metro Connect connections.
-
Maintenance: Upcoming and in progress change reports as well as a list of past change records.
-
Shipments: Lists of inbound and outbound packages.
-
Tickets: Remote hands and support cases related to items within the data center.
-
Access: Badge access events and lists of scheduled and current visitors, in addition to a record of past visitors.

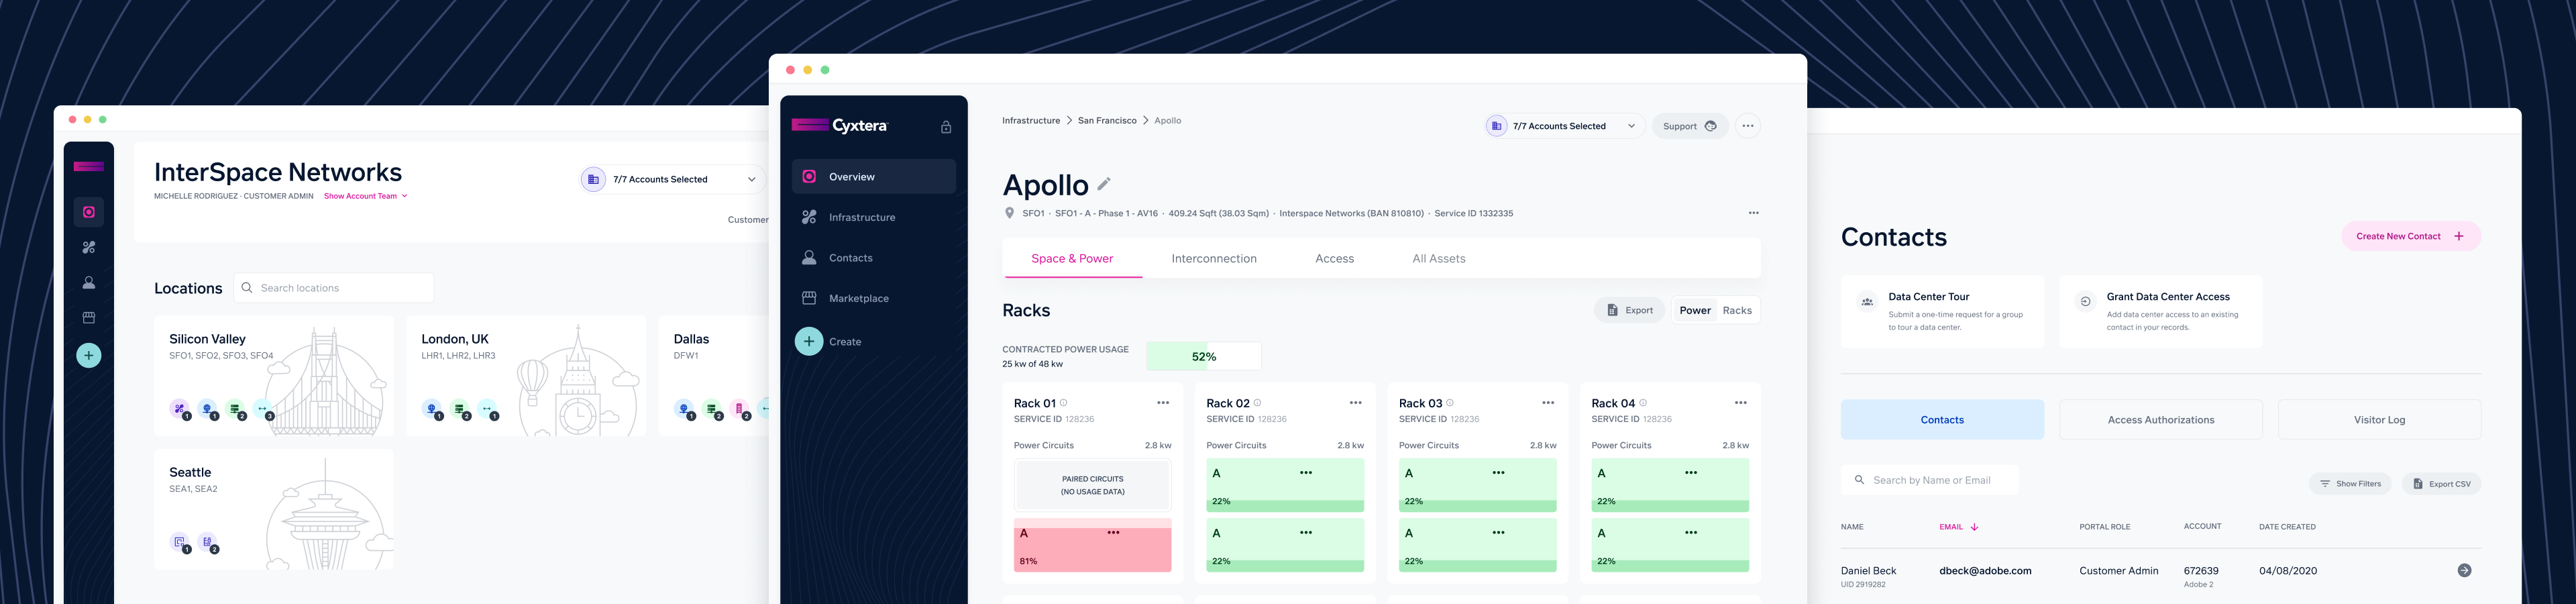
Viewing a Space
A Space is a cage or Secure Cabinet within the data center. The app displays your assets in every cage in a more detailed and contextual way. Each cage gets its own page in your interface. Select a location from Locations widget or Infrastructure page and choose a cage or rack from the options under each data center. Cages are indicated by an icon of stacked squares. You can also click on the Cages where they are listed on the Metro dashboard to view them.
This view is broken into three sections with tabs at the upper right:
- Space & Power
- Interconnection
- Access
- All Assets
The Space and Power view displays each rack within a cage (or a single rack if the rack is not located within a cage). Current power readings help you balance power usage across circuits for each rack. Circuits that reach above 80% of their capacity are shown in red to indicate they risk tripping the circuit breaker for that equipment. The “Total Utilization” bar at the top of the page shows the average usage for the past day compared to the your current committed electrical capacity (CEC).
The Interconnection view displays Ecosystem Connect Bundles within the Space. Each of the Ports on this page can be viewed on its own page where an alias can be set. This can help clearly indicate what the Z-side of the port is.
The Access tab allows you to see badge events, who has access to the space, and visitor logs for the area as well. You can also grant access to the space you are viewing right from this tab.
Finally, the All Assets page allows you to view all configuration items in the your space. This can help you find a simple list of all assets of a given type, e.g. all Cross Connects in a particular Billing Account Number (BAN).

Updated about 1 month ago