Manage Colocation
The Cyxtera Portal allows you to remotely view and mange your entire colocation presence.
The Cyxtera Command Center allows you to deep insight into your colocation environment from anywhere in the world. When combined with our Remote Hands service, you can manage your infrastructure completely remotely.
Data Center Dashboard
From anywhere in the portal, selecting “Spaces” in the navigation displays a list of data centers with every one of your Spaces in the data center grouped within. Selecting any of the data centers brings you to a dashboard just for that data center. This is the place to see cage power usage trends, maintenance reports, shipments, and visitors for this data center.
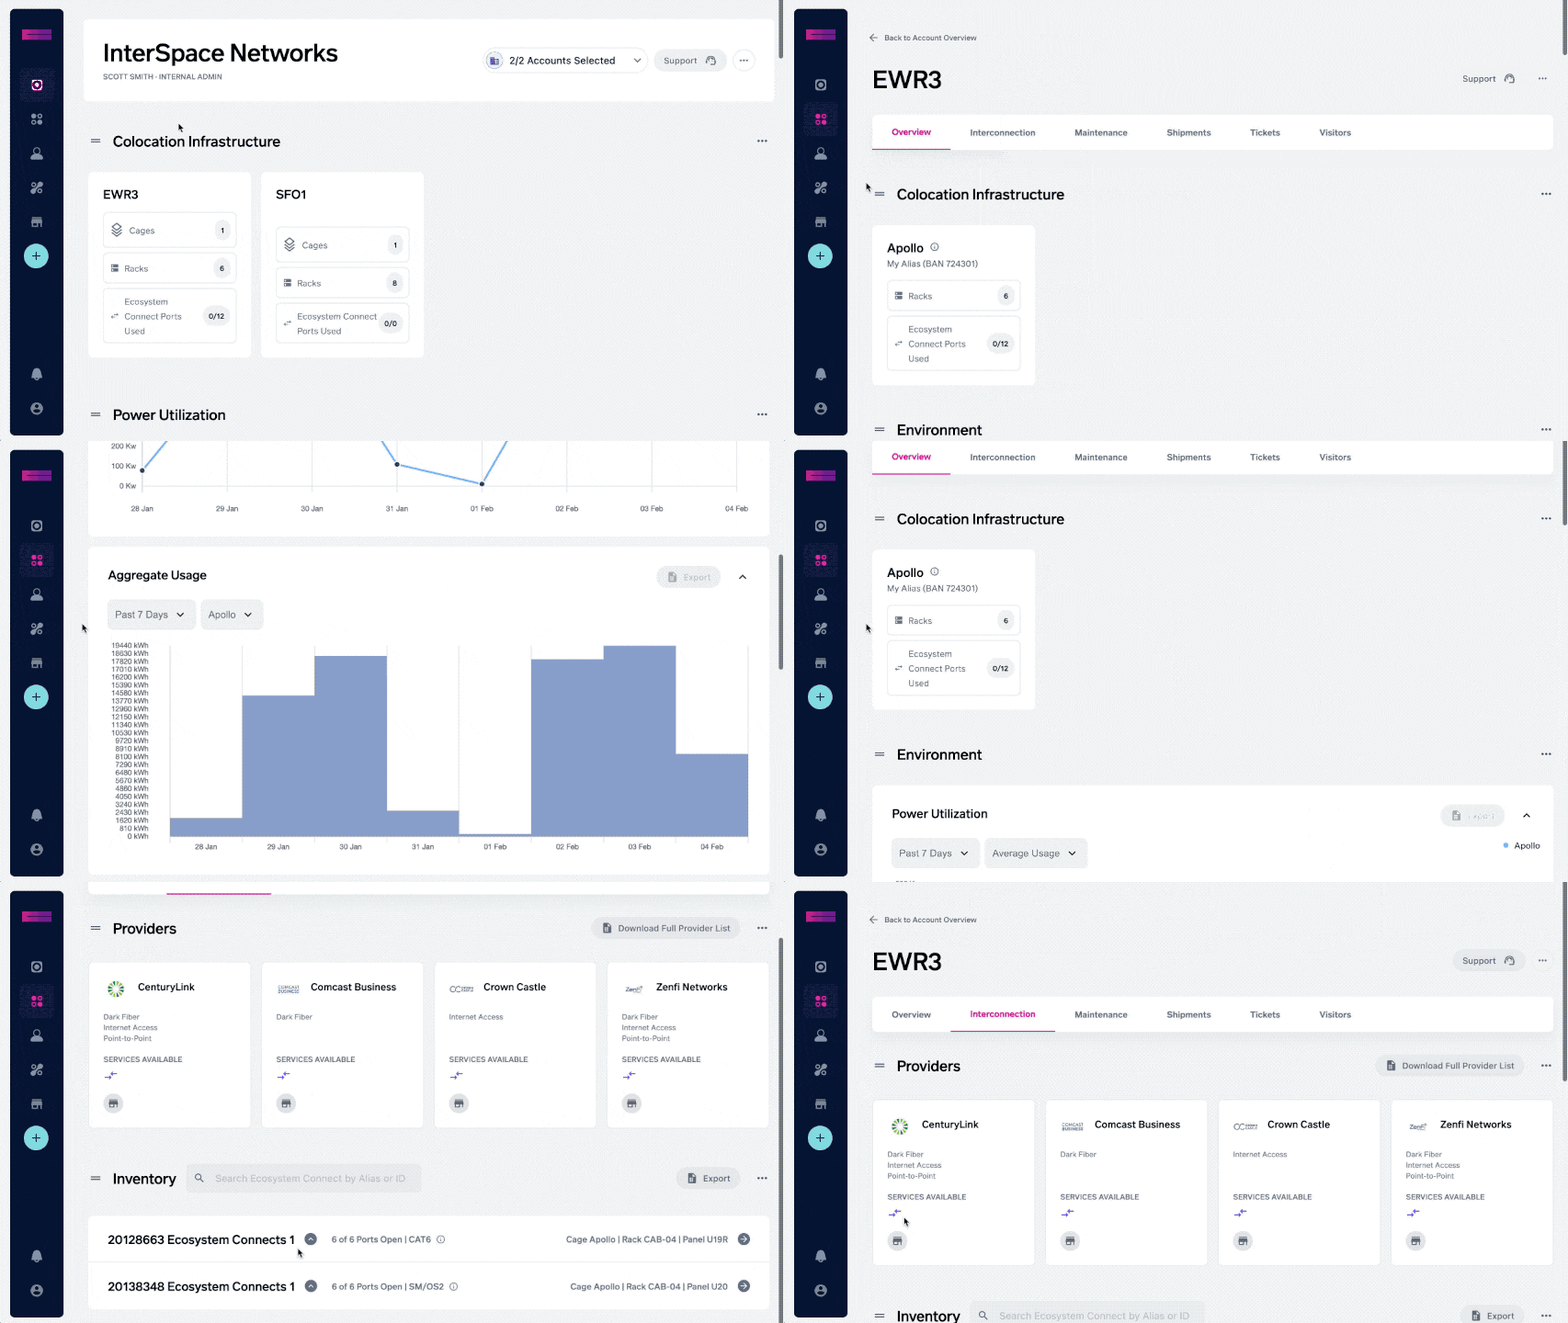
Power Trends
On the overview tab of the data center dashboard, you will find an “environment” widget displaying daily peak power usage across your cages in the data center. There are also options to display daily information for the month prior and plot average daily usage instead of peak usage. A red triangle will indicate the highest value in the present view, making it easy to find a peak in a week or month.
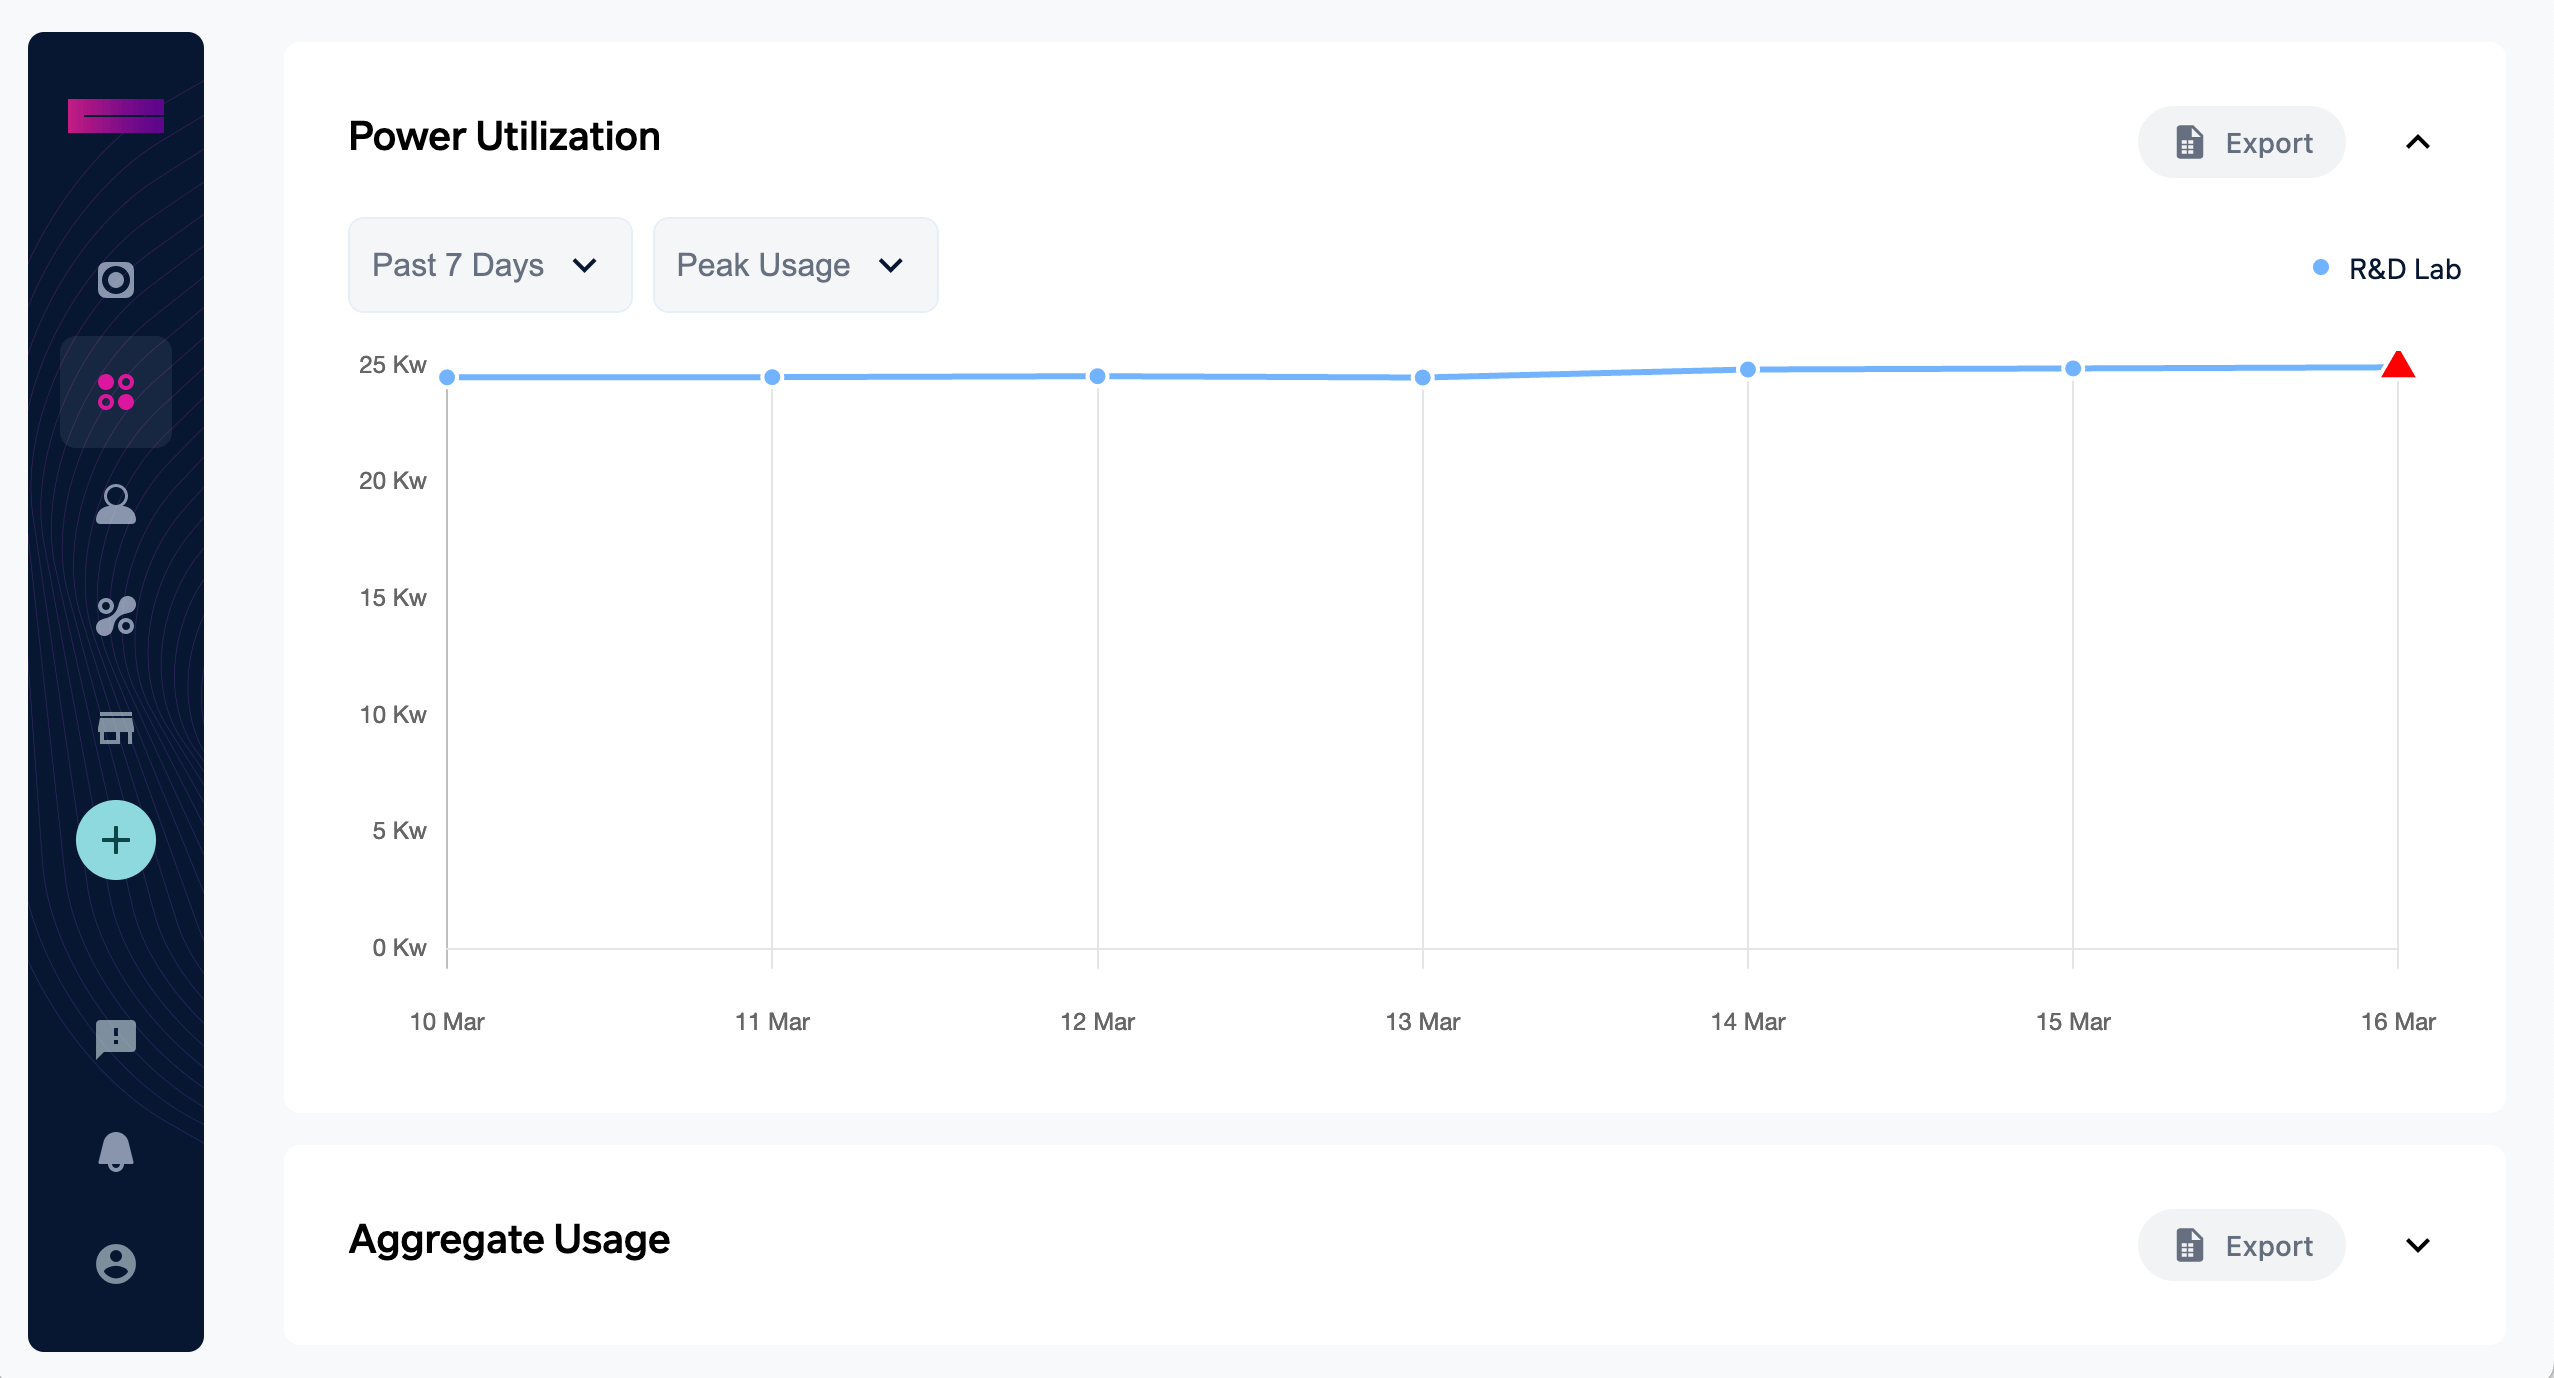
Interconnections
The Interconnections tab displays provides from the Cyxtera Marketplace located in the same data center. This allows you to easily see other customers in the data center who are available for peering.
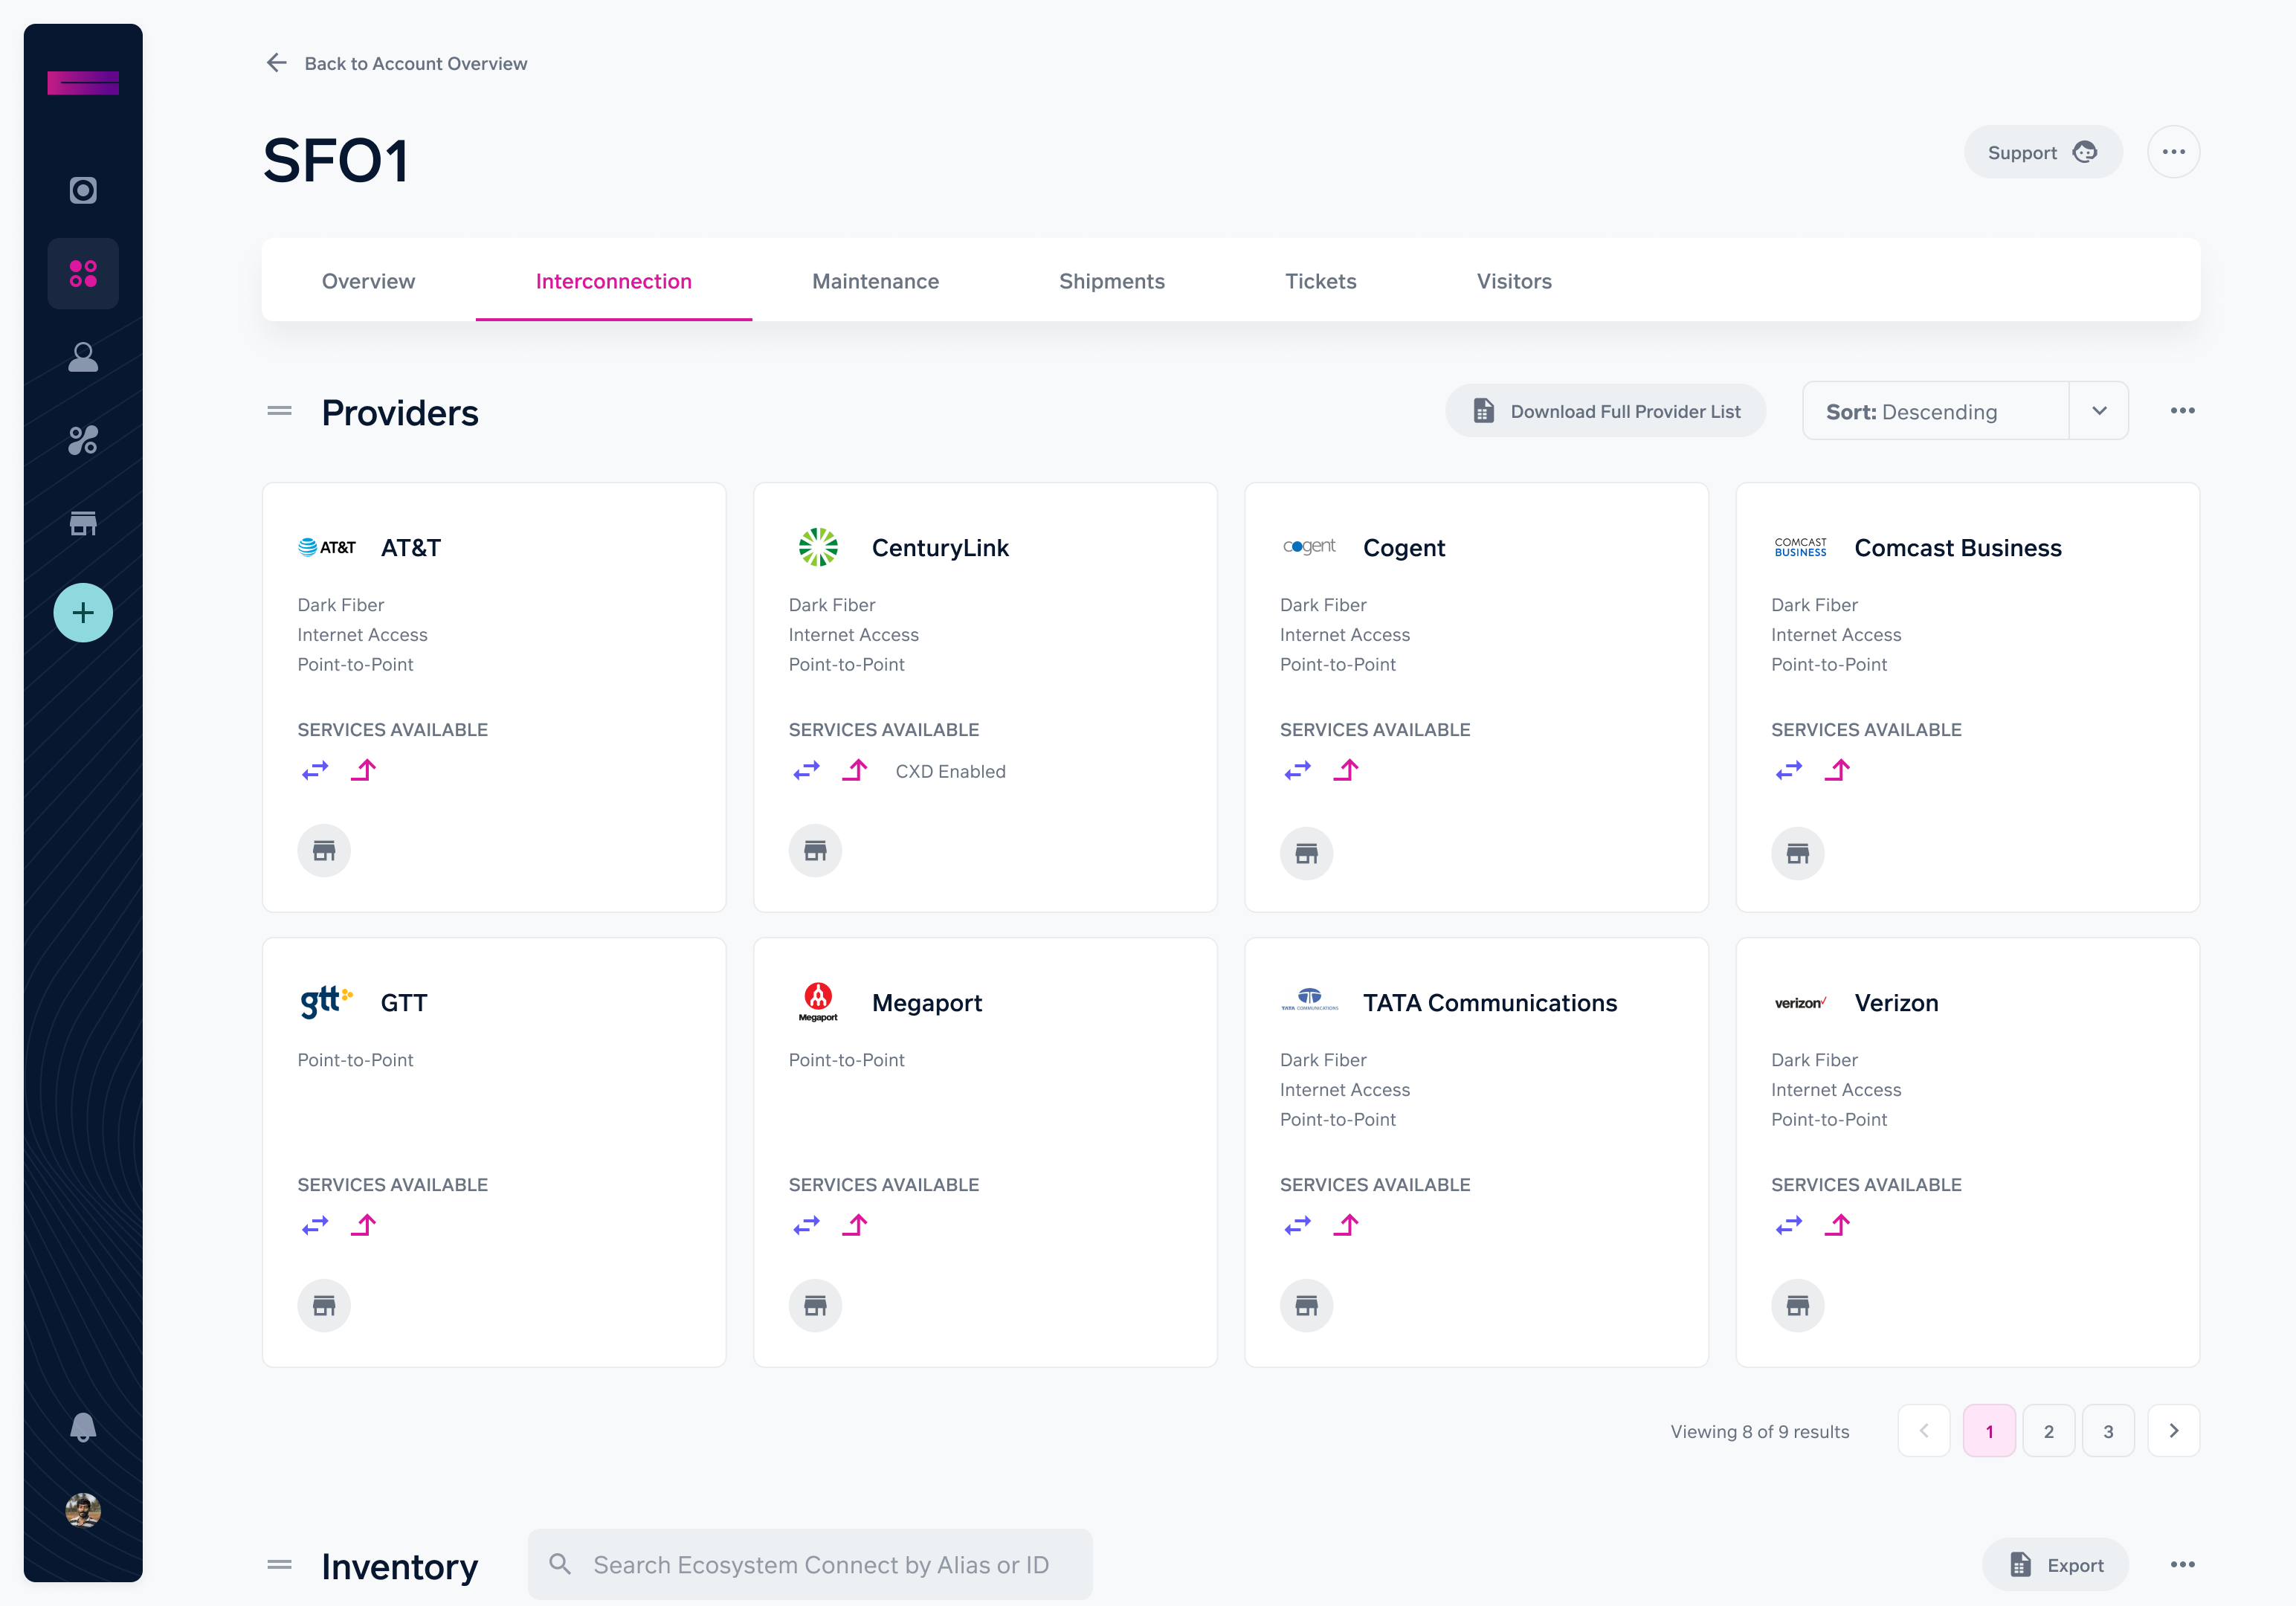
Further down, you can find widgets list Cyxtera Network Panels, including Ecosystem Connect, Interconnections, and other interconnection products located in that data center. Selecting a network panel or interconnection shows additional information such as the connection information and allows you to disconnect the interconnection right from the portal.

Shipments
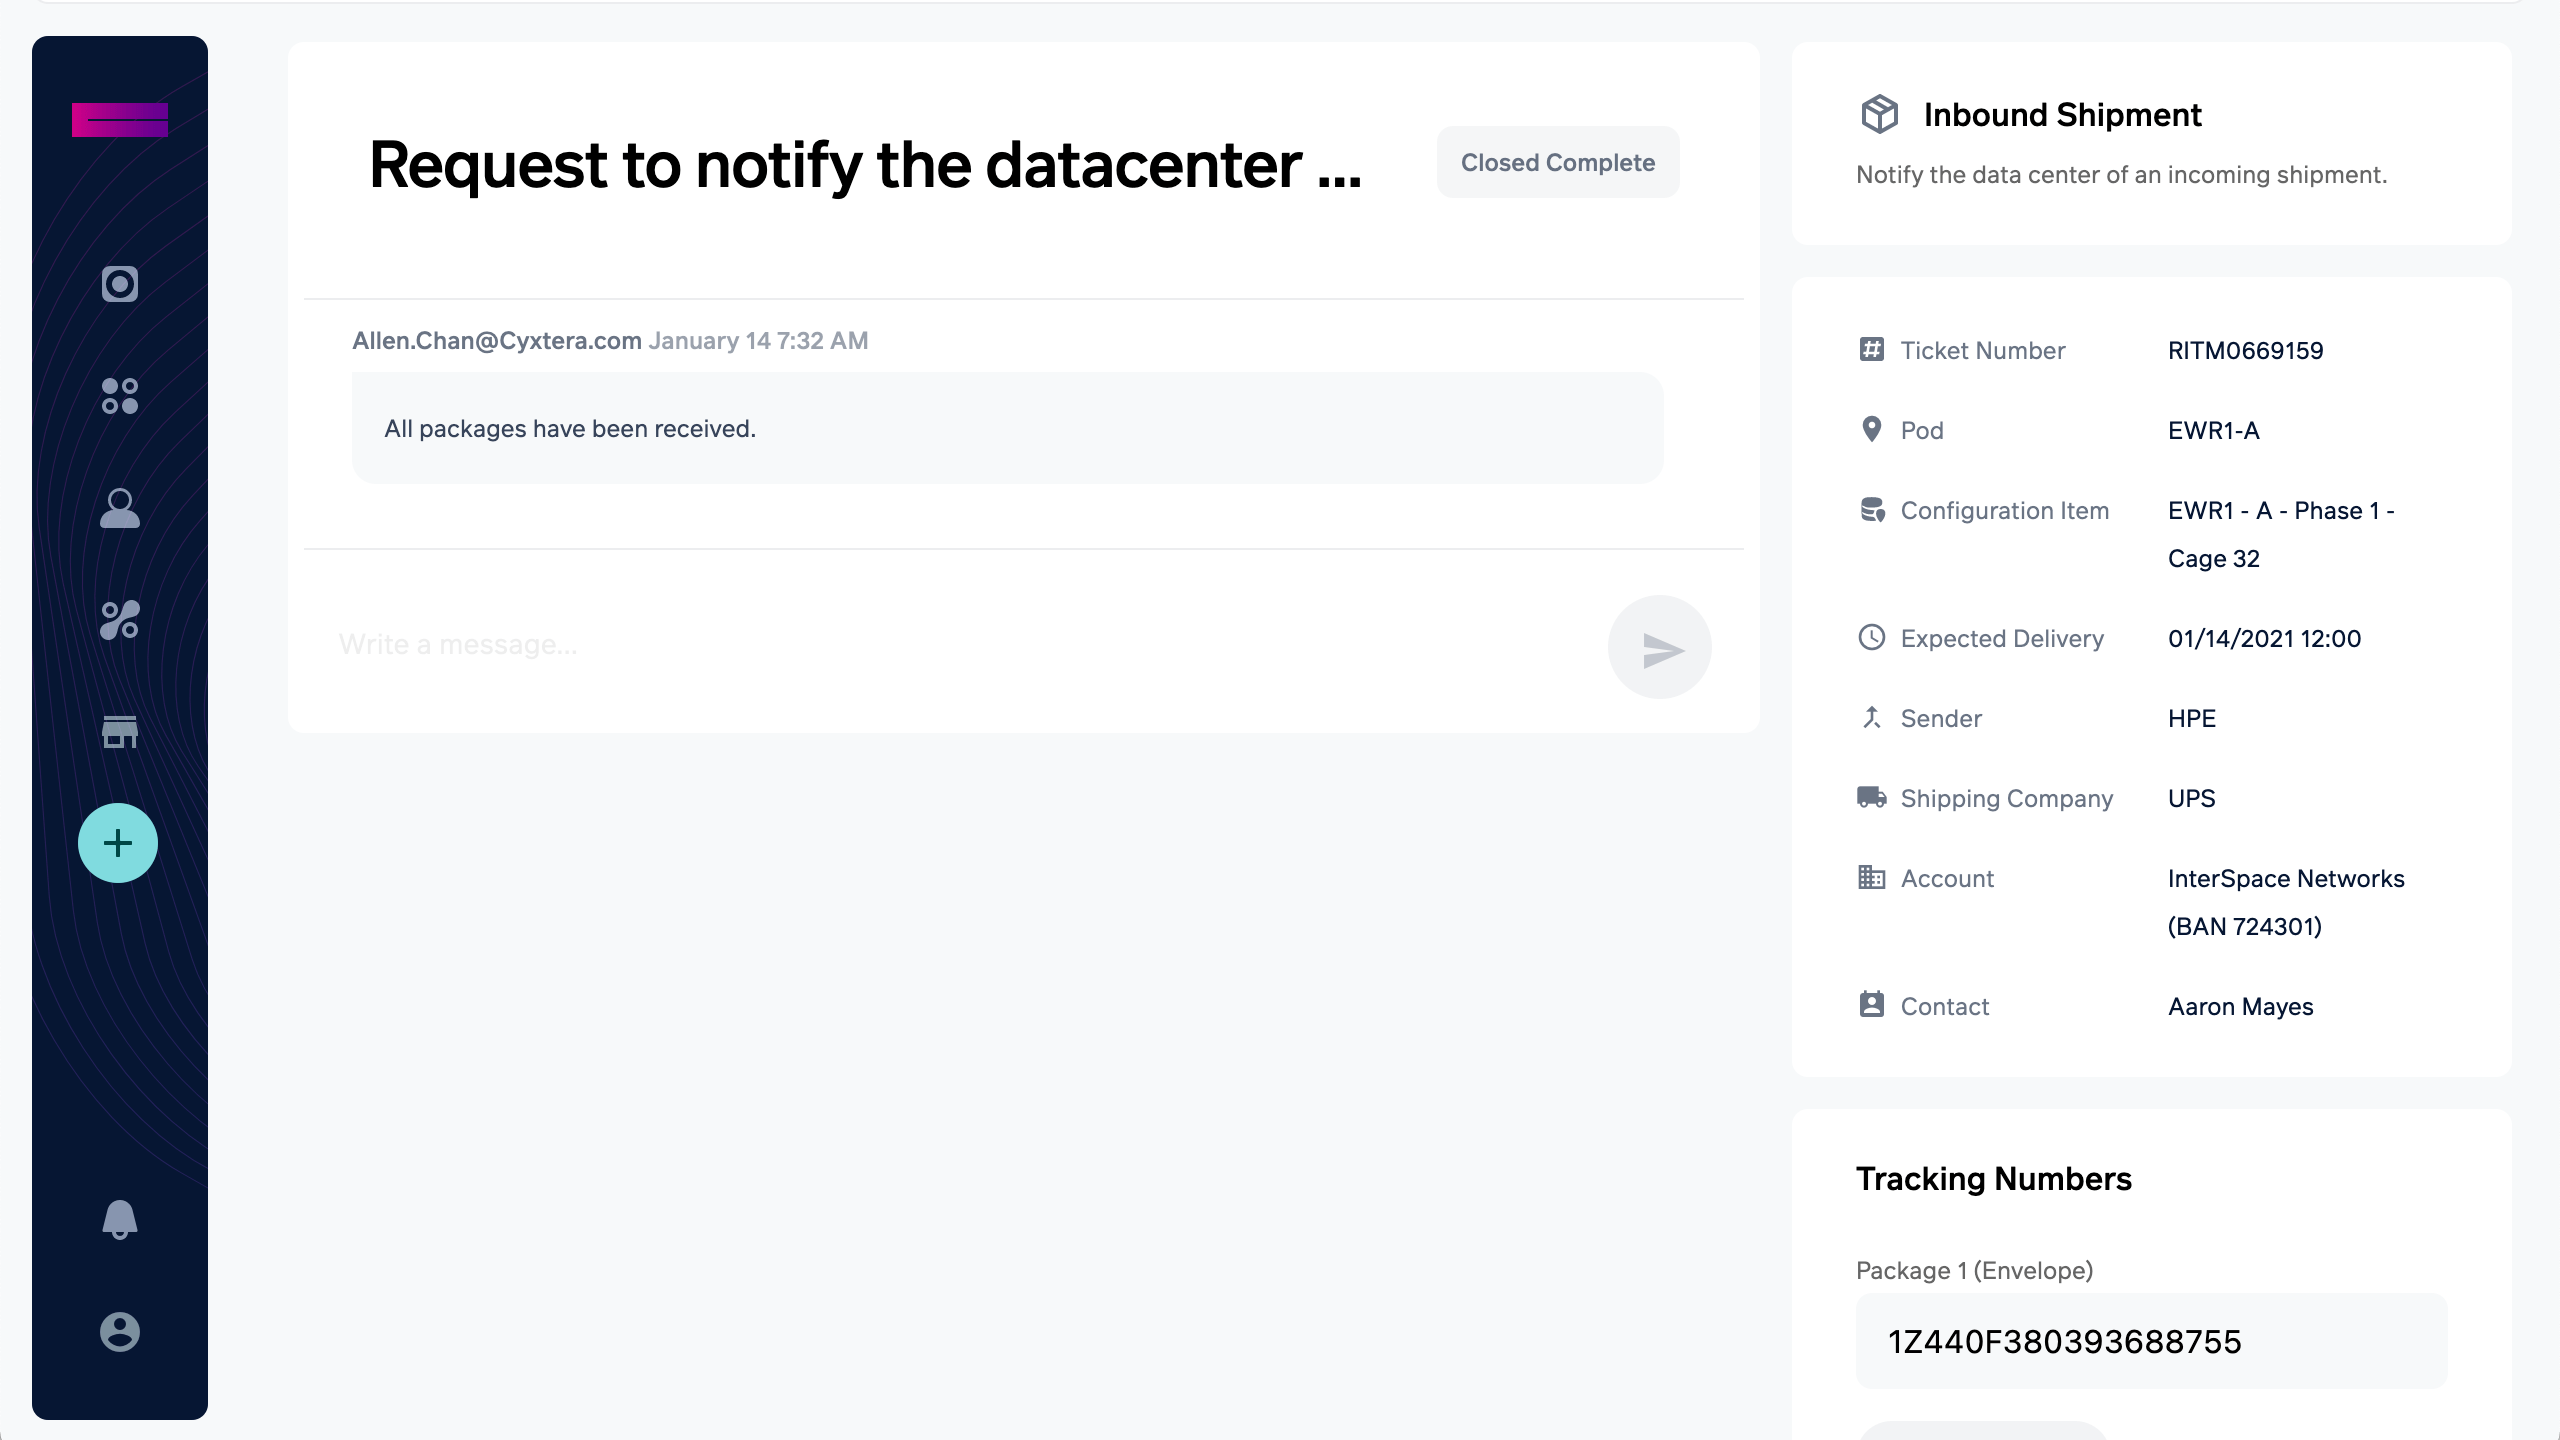
On the overview tab, there is a Shipments widget highlighting three groups of packages: those that are expected to arrive at the data center, packages in storage, and packages expected to leave the data center. From this widget, you can create a shipment or click “view all” to see all packages coming and going from the data center on the Shipments tab. On the shipments tab, you can view every package record on your account.
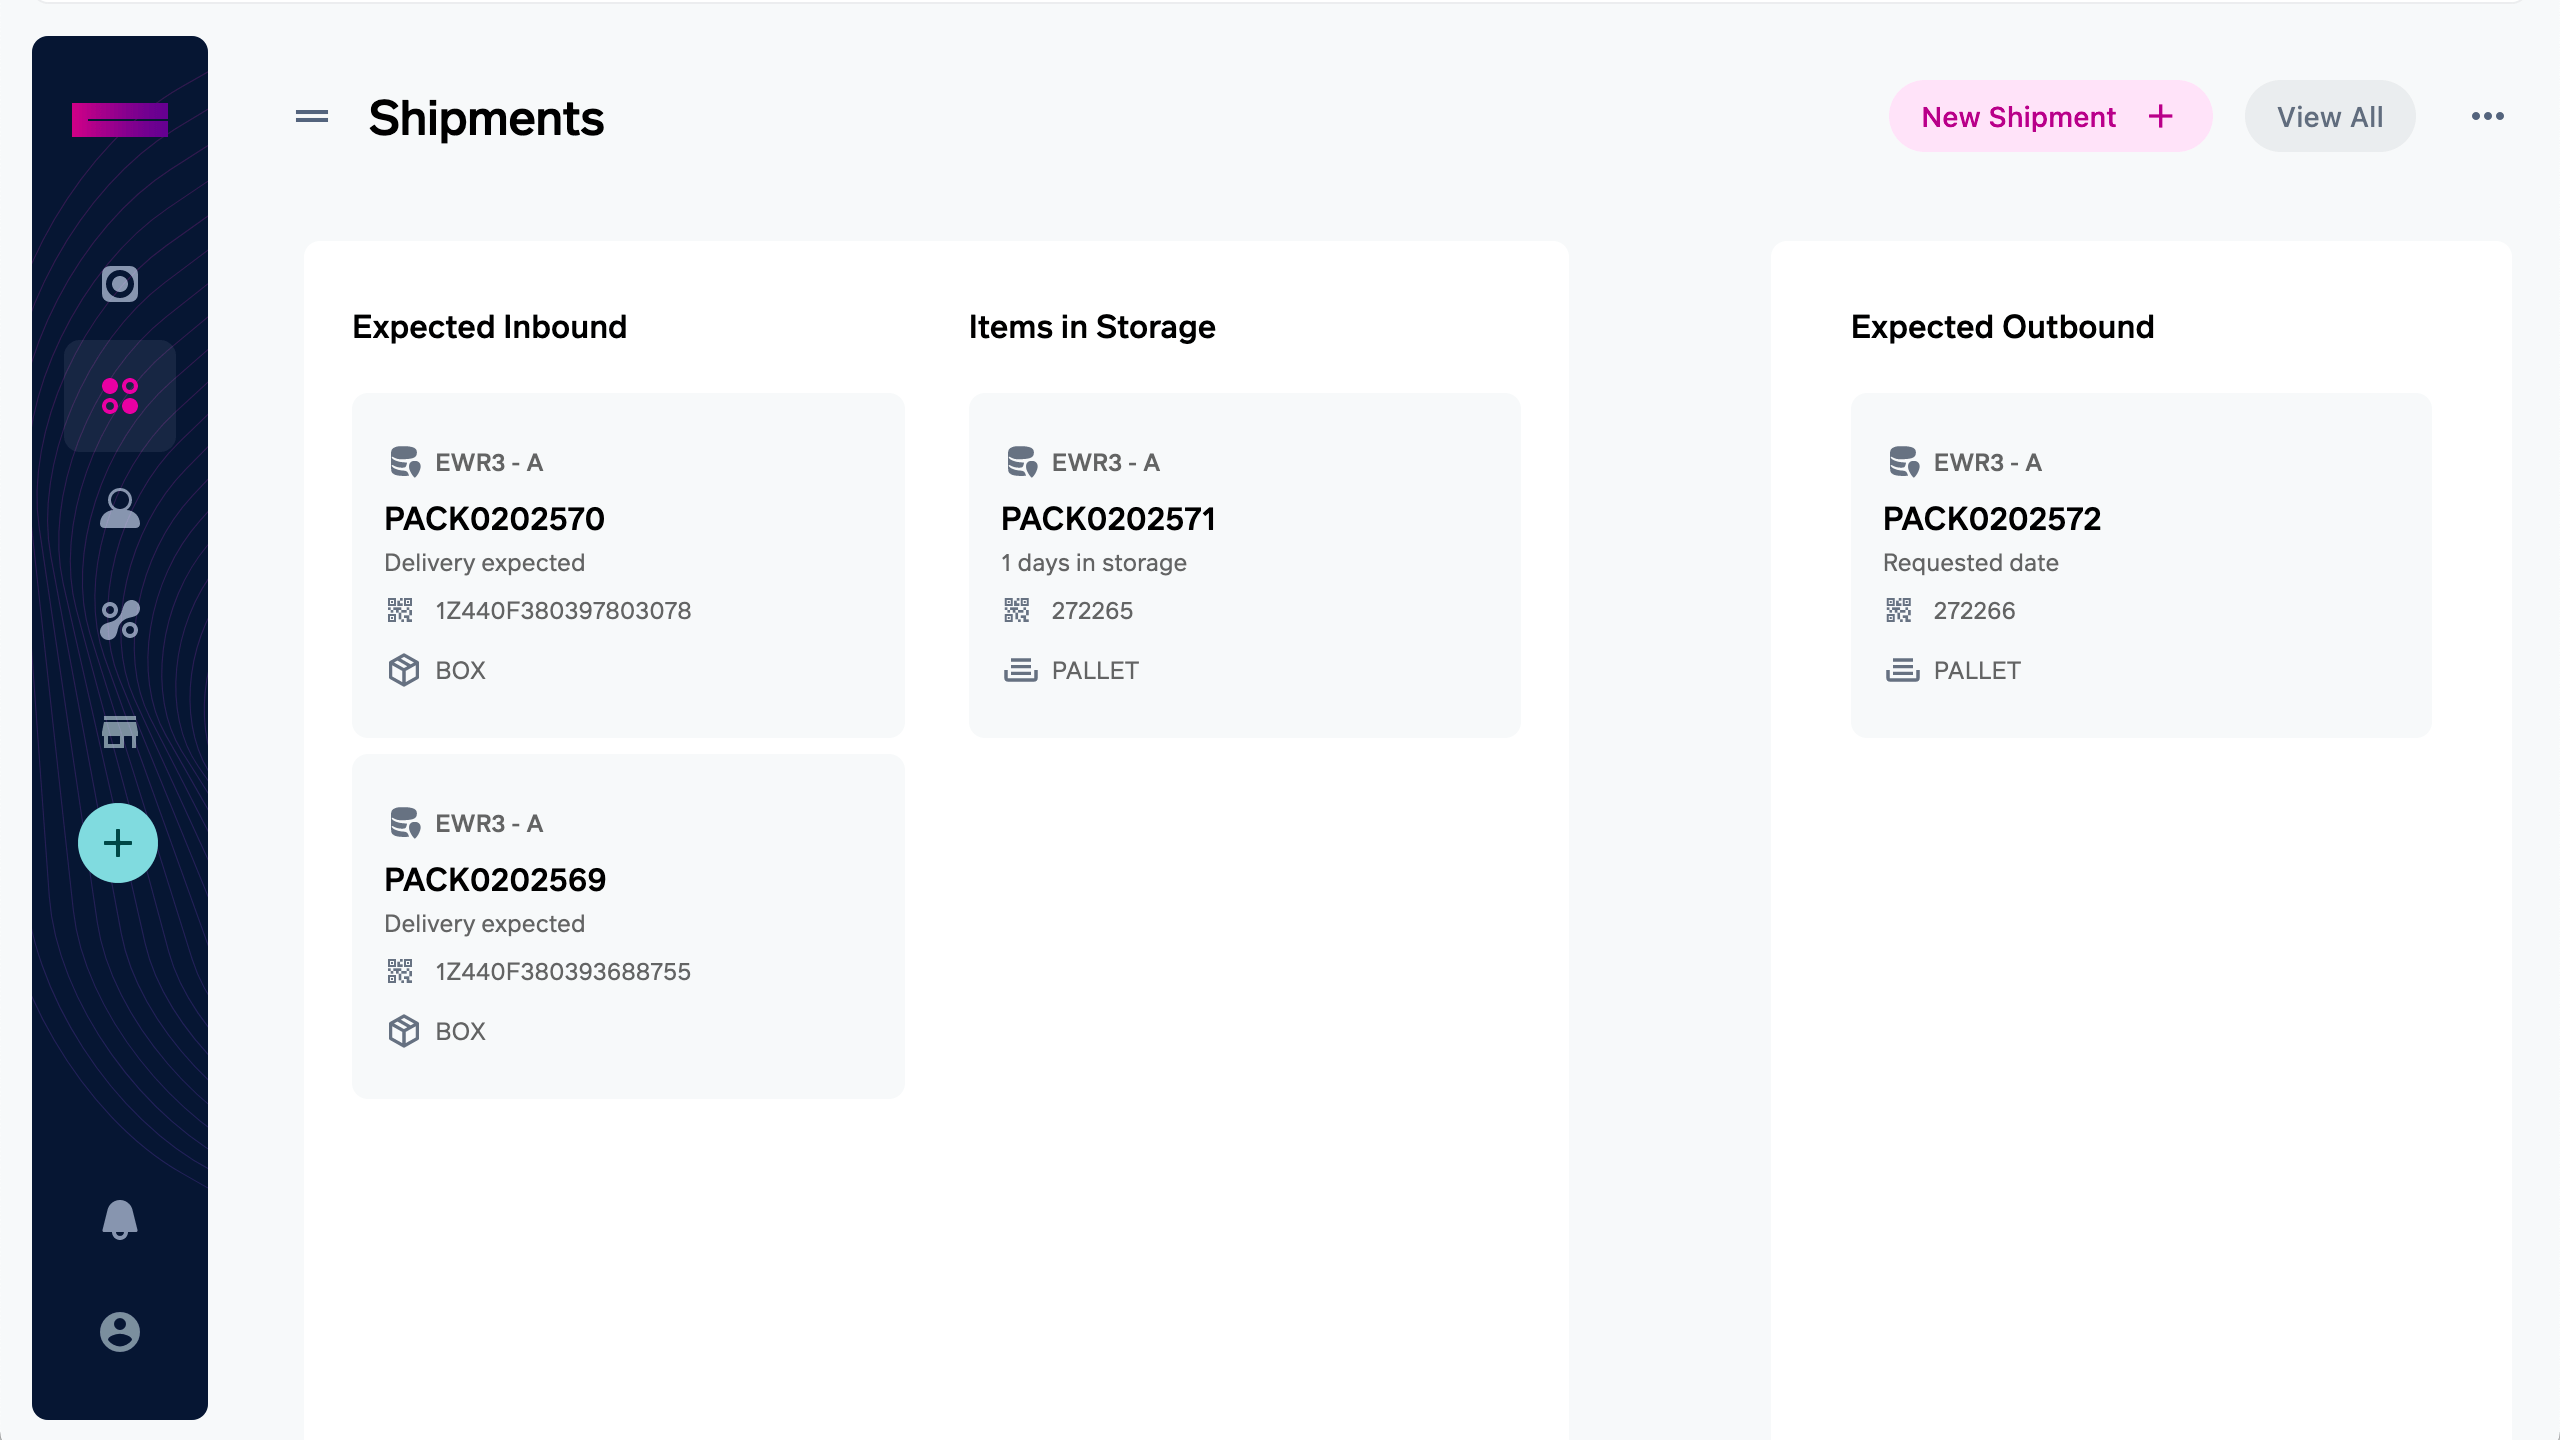
Selecting a package on either of these views displays the request ticket used to track all packages in the shipment. The left side displays any messages appended to the ticket while the right hand side shows tracking numbers and the status of individual packages within the shipment. On this page, it is possible to add and update tracking numbers as well, helping our data center site teams associate incoming packages with your account.
Maintenance
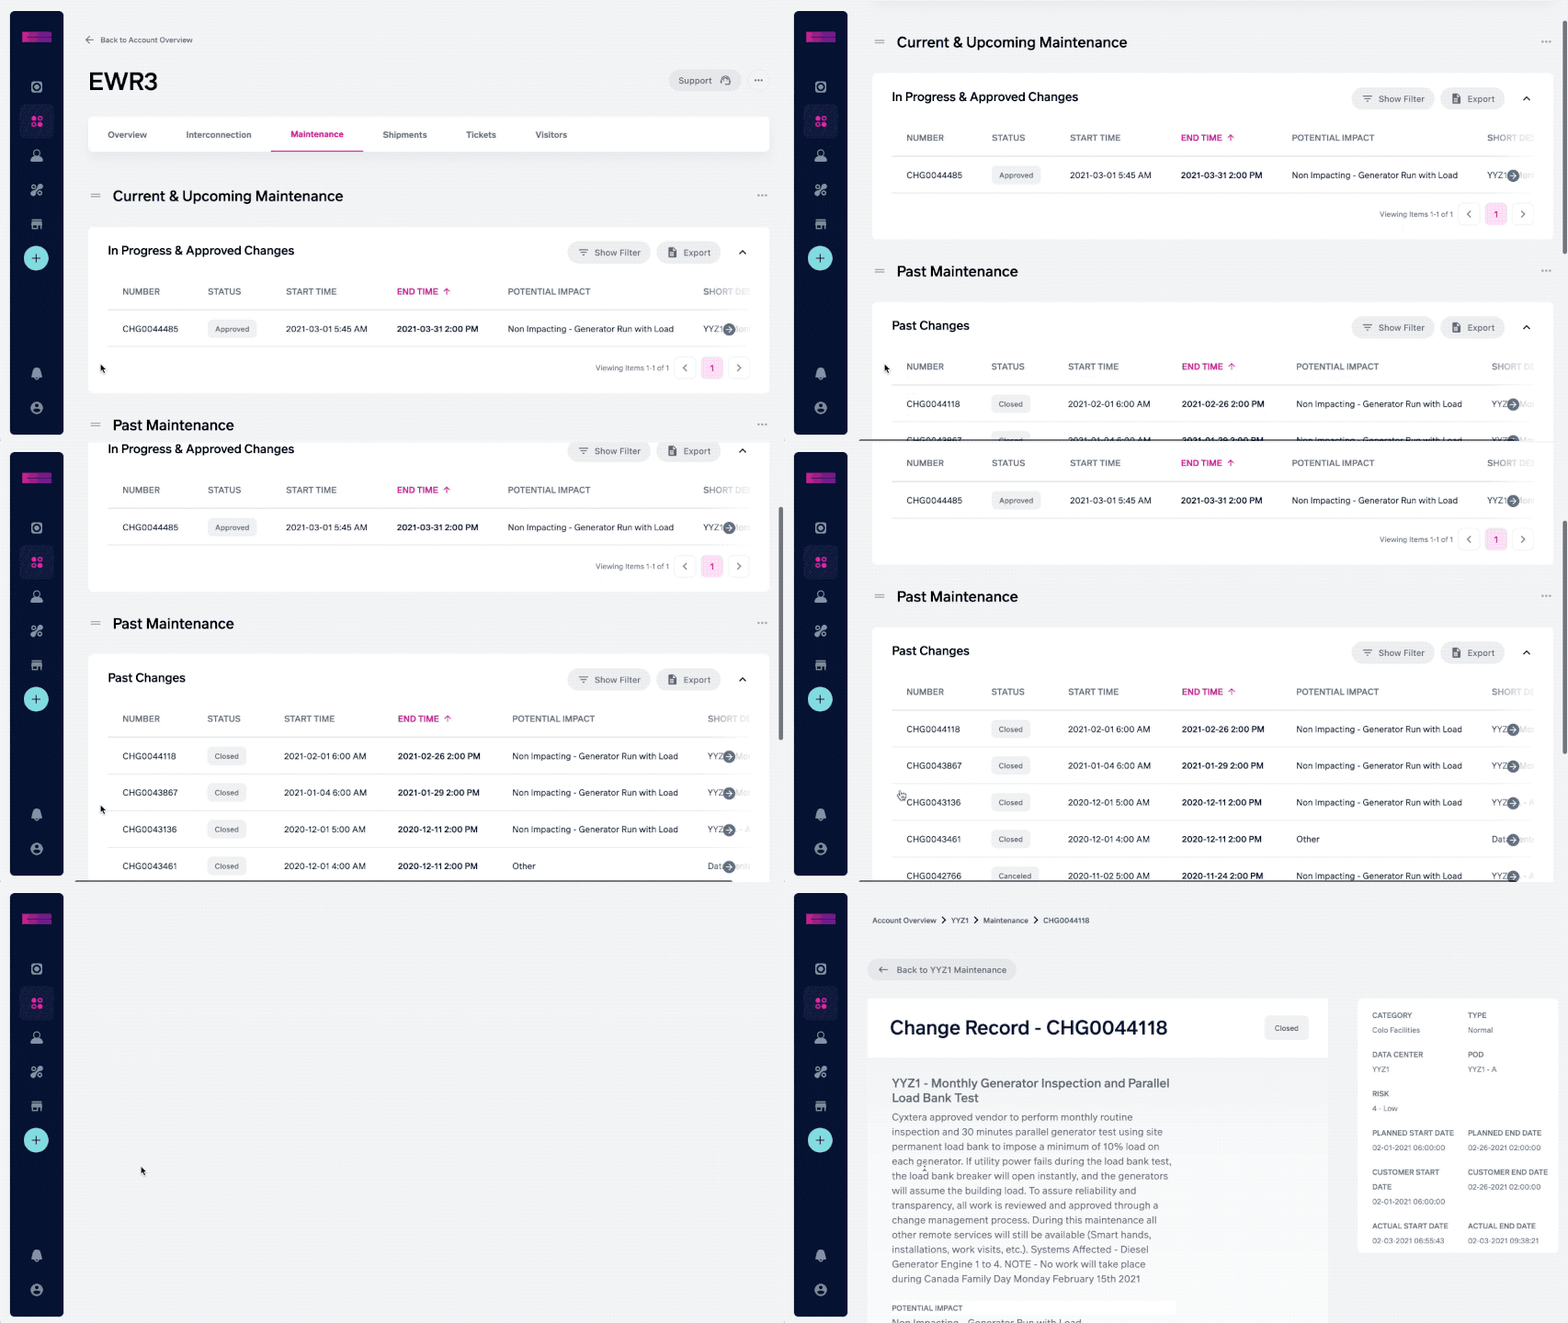
Selecting the “Maintenance” tab near the top of the dashboard displays two sections of maintenance records. The first displays upcoming and in progress maintenance you should be aware of. The second section shows maintenance that has occurred over the past three months. Selecting any of these items displays additional information so you are aware of any changes to the data center.
Access
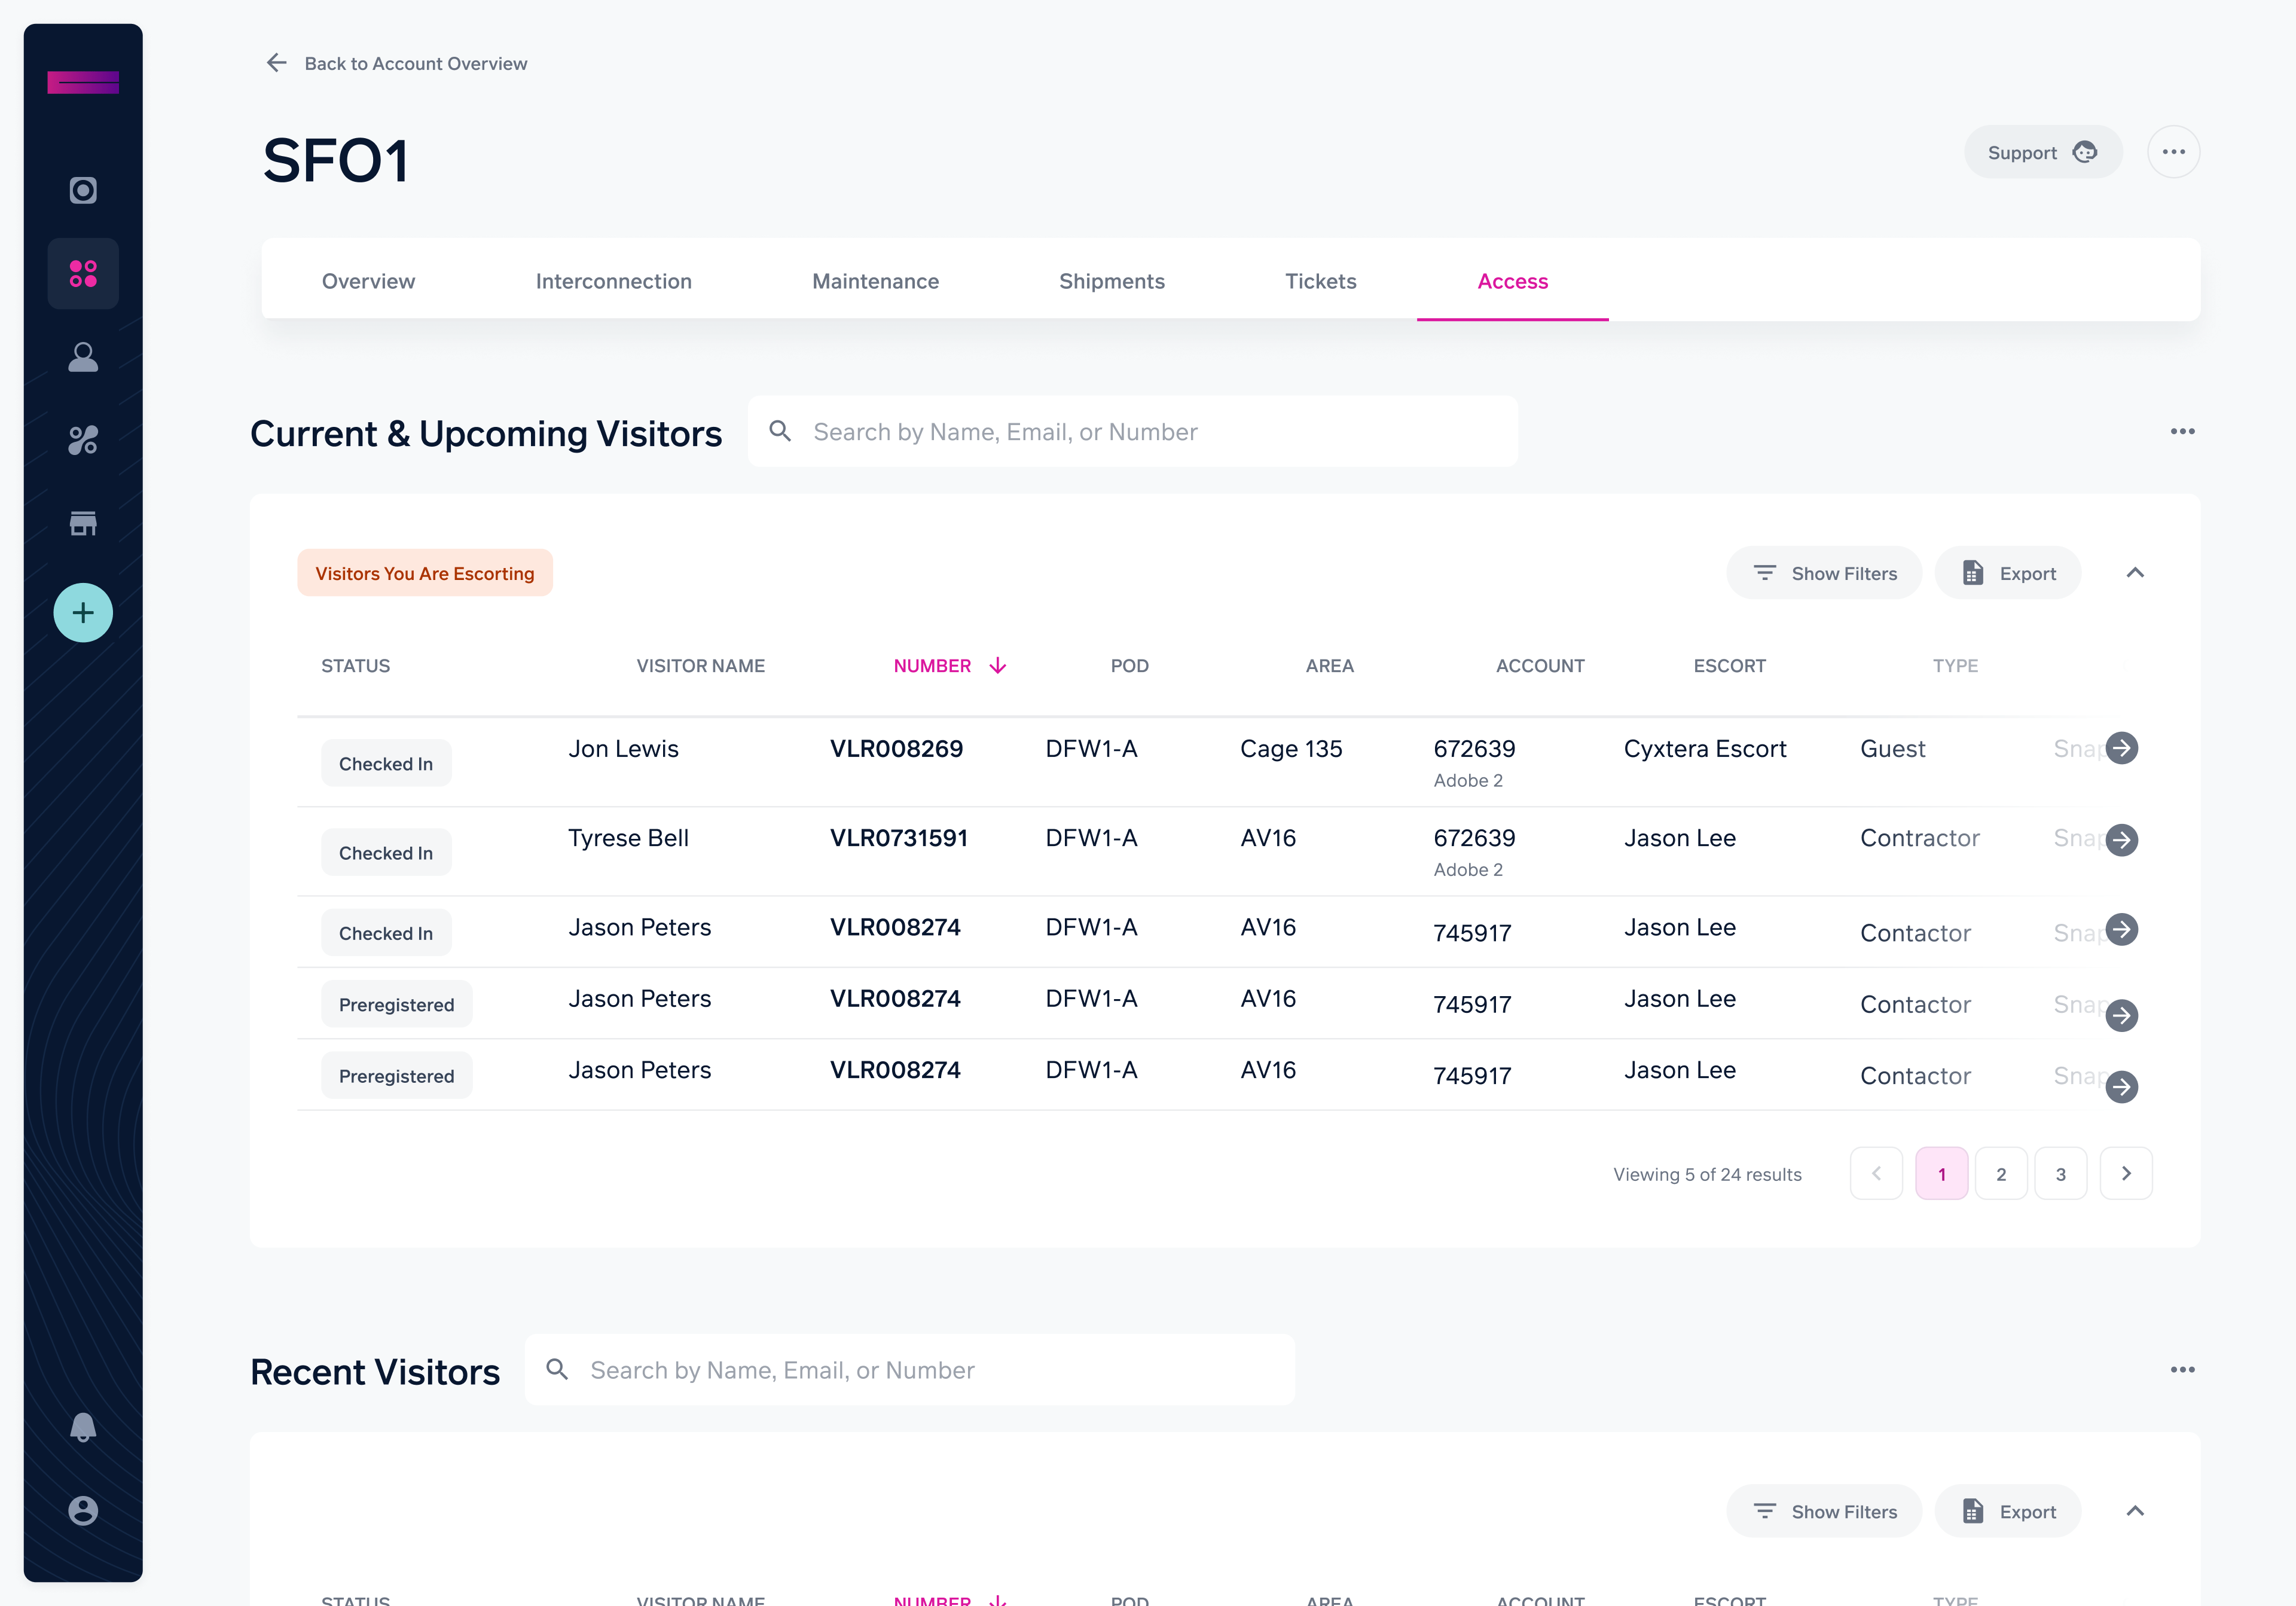
Selecting the “Access” tab also displays two sections of content. The first section shows visitors currently checked in or preregistered to the data center and highlights any you may have been assigned to escort. The second section displays visitor logs for recent visitors to the data center. This table can be quickly exported as well in order to simplify audits and reporting. More detailed filters and options are available in the Contacts page of the app under Visitor Logs.
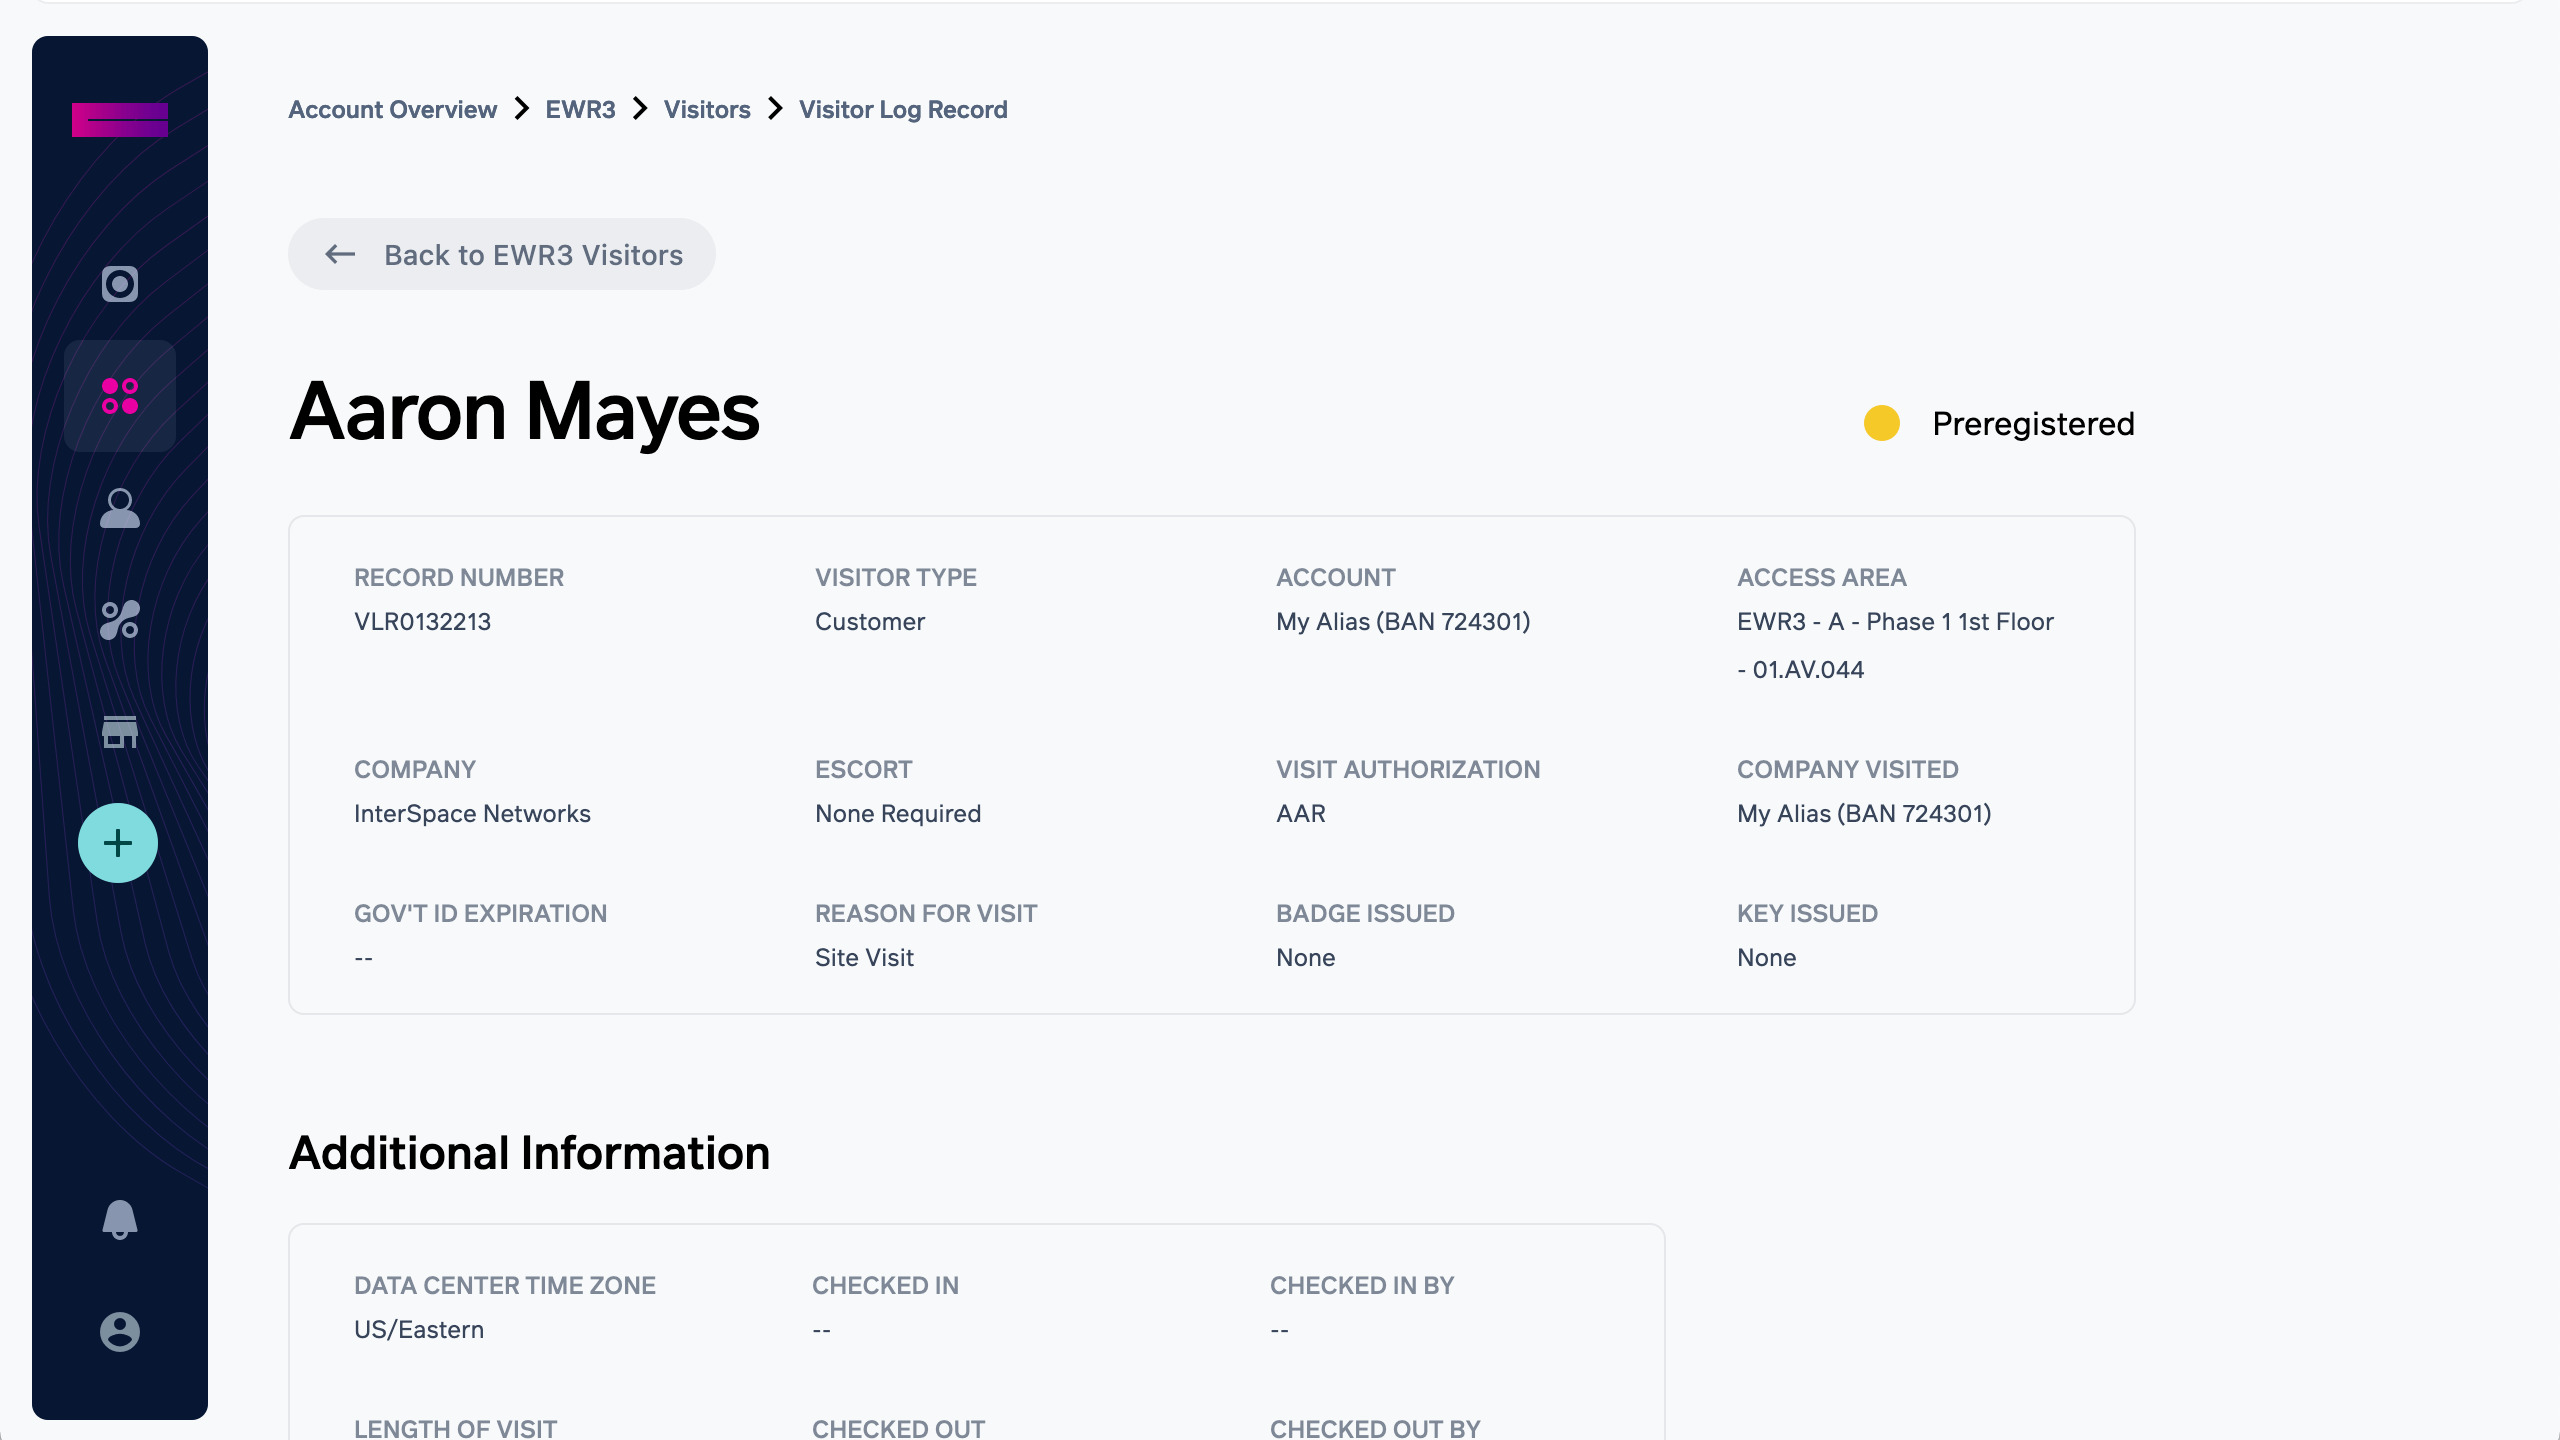
Selecting any of these records provides additional information for the visit including what area was visited, exactly when they checked in and out, whether they were escorted, and the reason for their visit. For more information about how to allow access to your space within the data center, read Grant Data Center Access.
Space & Power View
Choosing a cage or rack from the Spaces selector or from the “Colocation Infrastructure” widget on a data center brings you to a contextual view of your assets in that area.
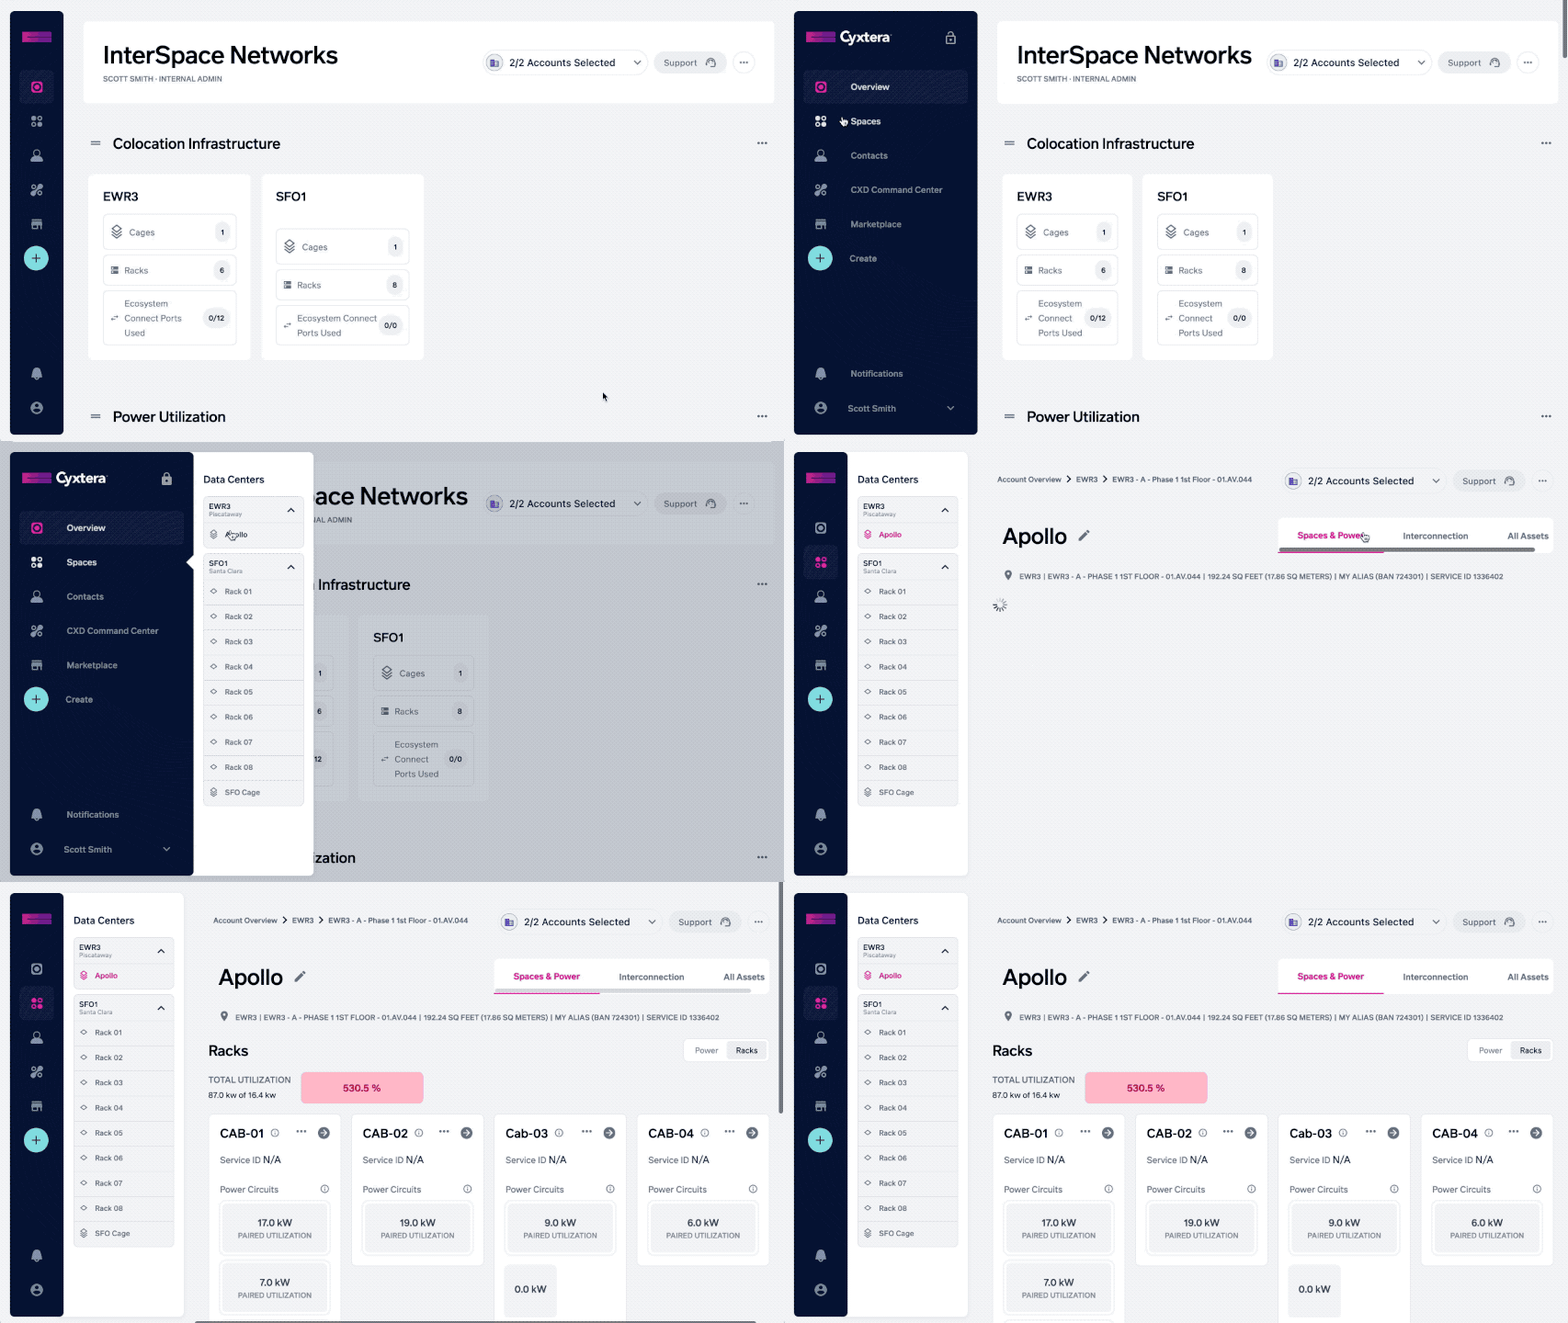
By default, the Space & Power tab is shown. This view displays each rack in the cage and the power circuits associated with that rack. Cyxtera provides current readings of each circuit. This can help you balance power draw across the circuits on each rack. It is important to see which circuits are drawing more than 80% of their rated load due to risk of tripping a circuit breaker. Customers are responsible for ensuring they do not trip a breaker and this view helps make that a possibility.
The ellipse (…) icon on any of the racks provides you the ability to Creating a Remote Hands Ticket related to that rack. This can help you easily remotely manage work that needs to be done on equipment on that rack.
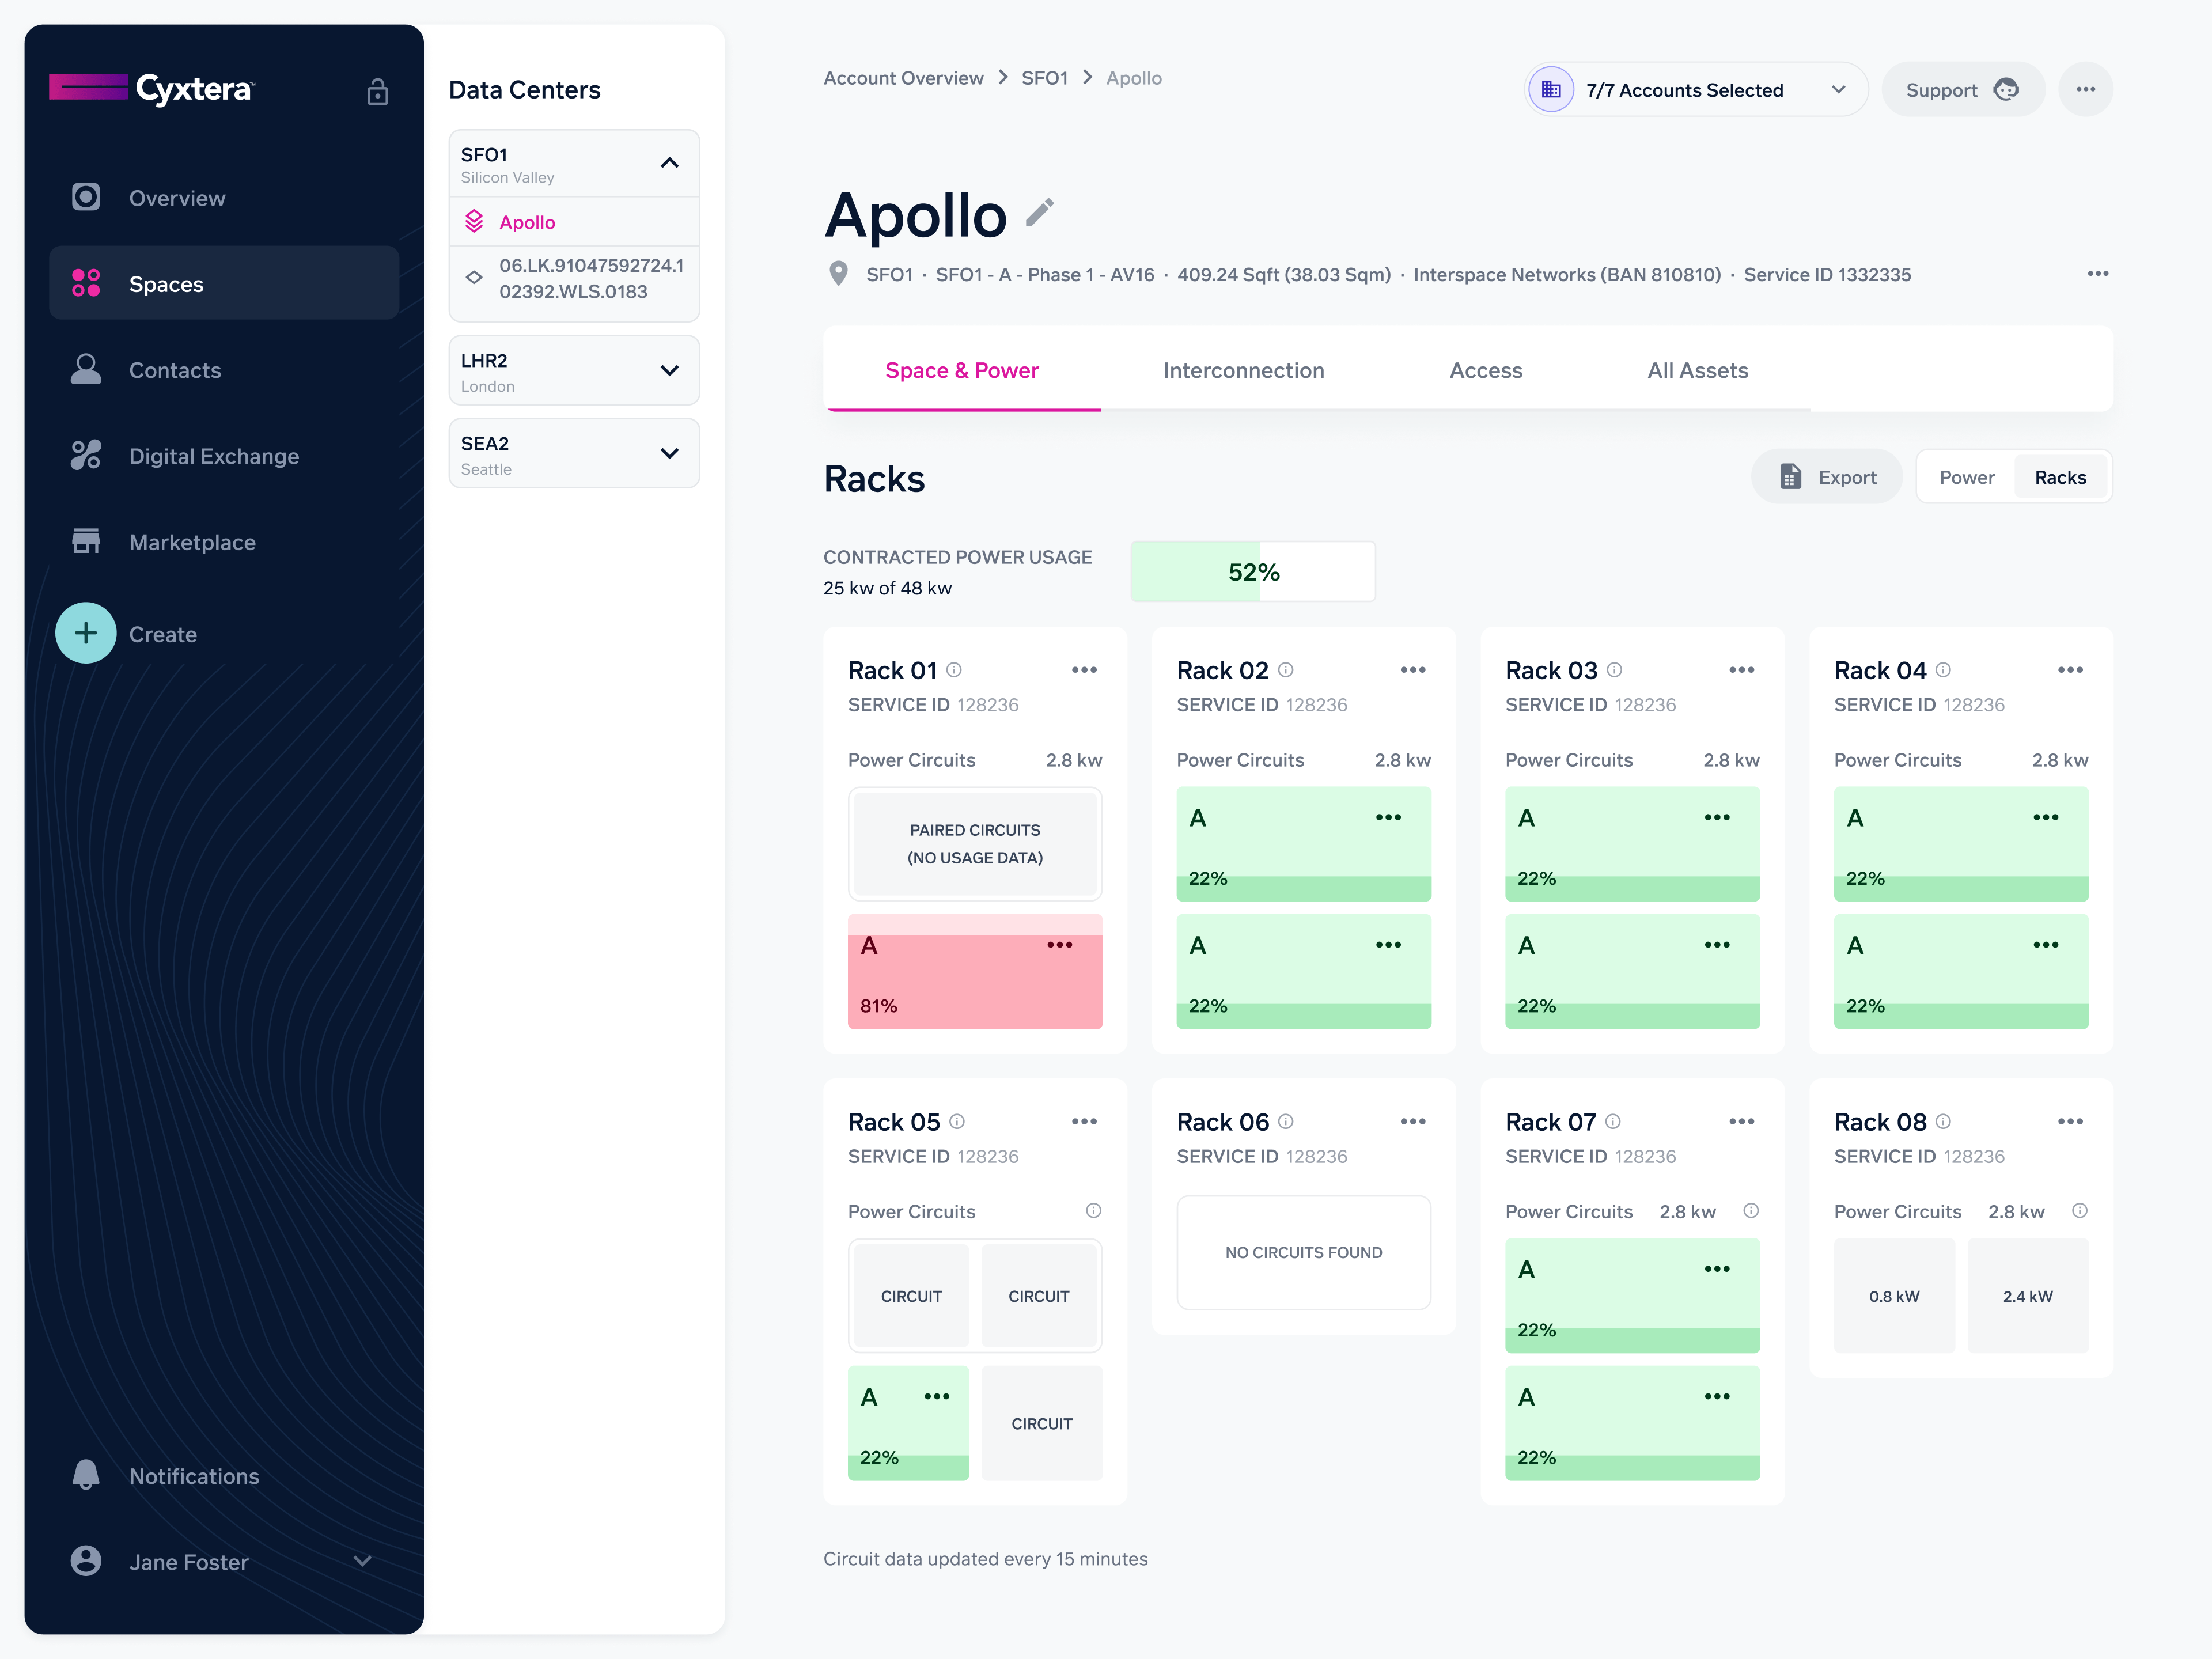
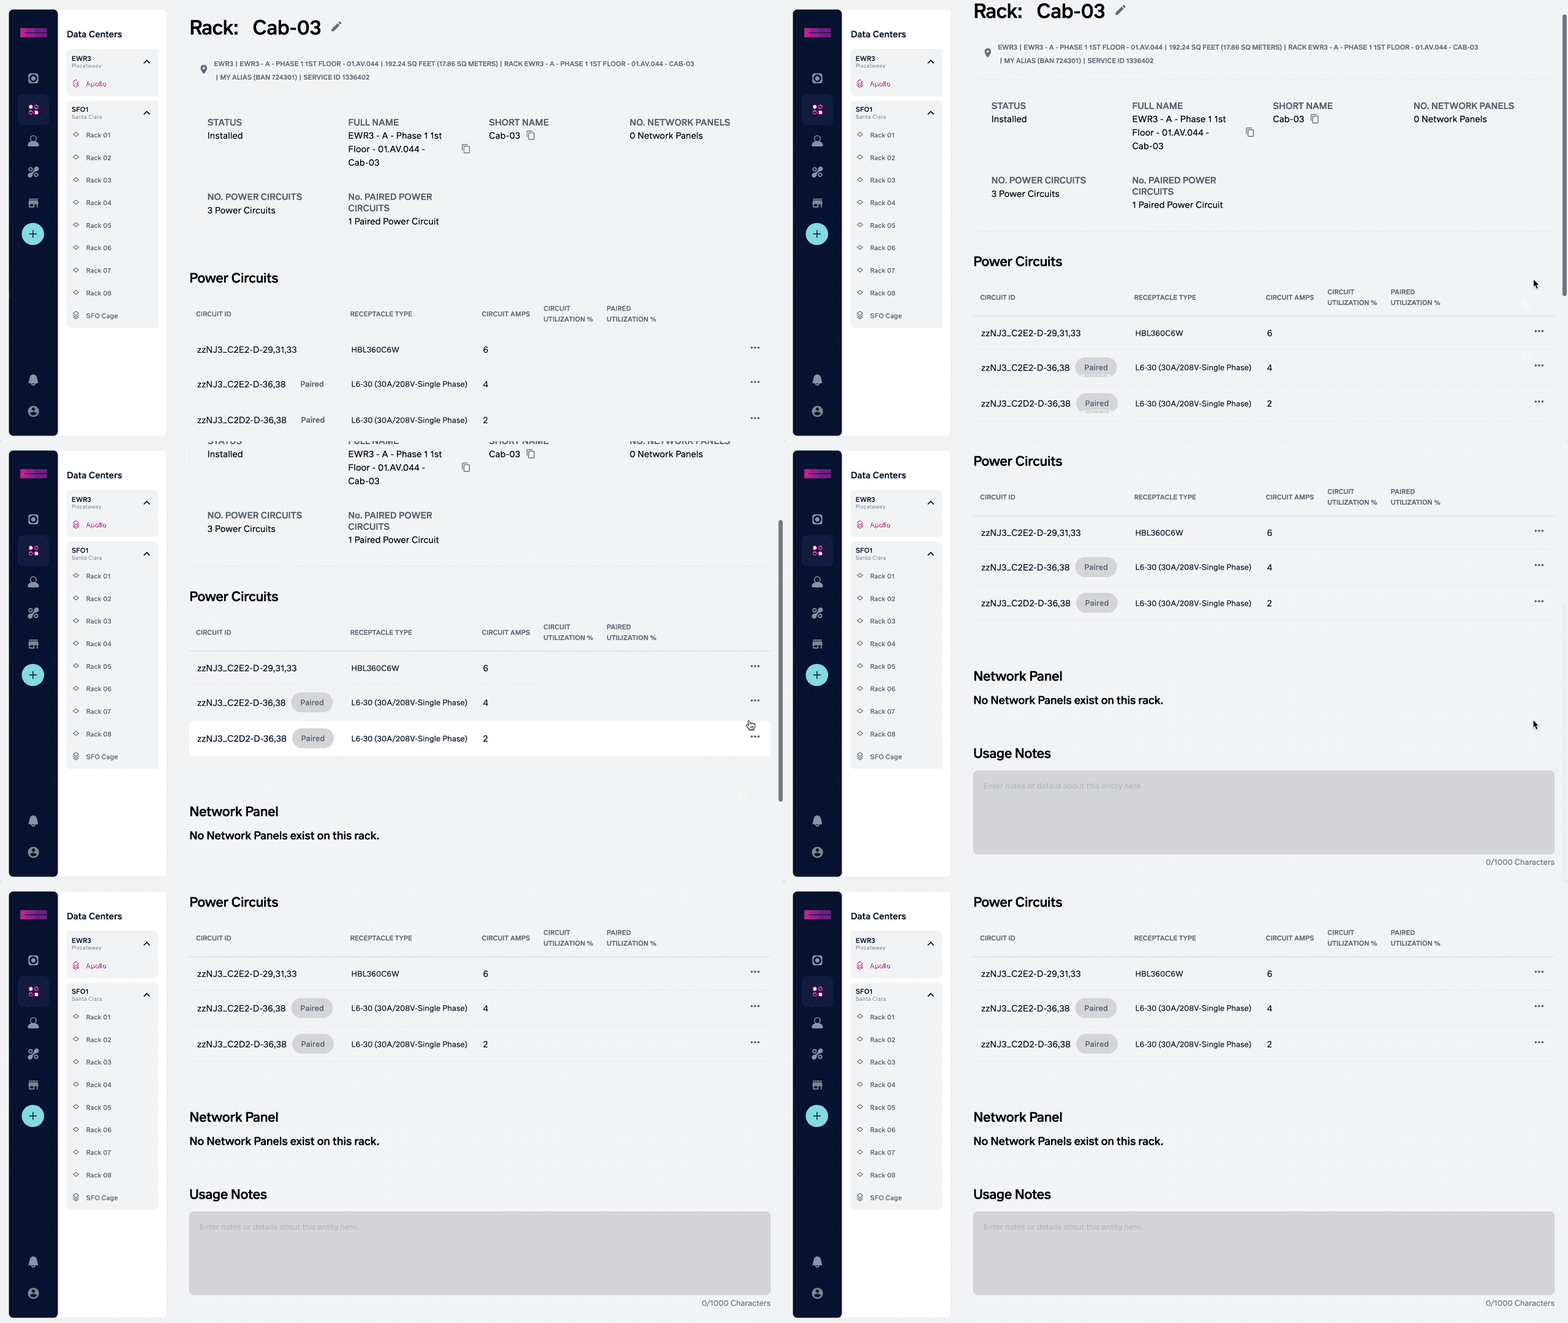
Selecting a rack provides a page listing each power circuit associated with that rack as well as any network panels that contain an Ecosystem Connect. On this page, you can add usage notes viewable to all members of your account and an alias for the rack. This can help you keep track of what equipment is on the rack and perhaps use a more meaningful identifier for the rack than the one given by default.
Interconnection View
Interconnections can also be viewed in the context of a single Space (cage or standalone secure cabinet). On a Space, select the "Interconnection" tab located at the top right of the page to see a list of Ecosystem Connect bundles organized by network panels.
In this example, we see the grid view (List view is also available by selecting the "Grid/List" toggle located below the tabs) of the Ecosystem Connect bundle we previously looked at on the Data Center dashboard. This view can be very helpful as it allows you to see a near-physical representation of your port usage.
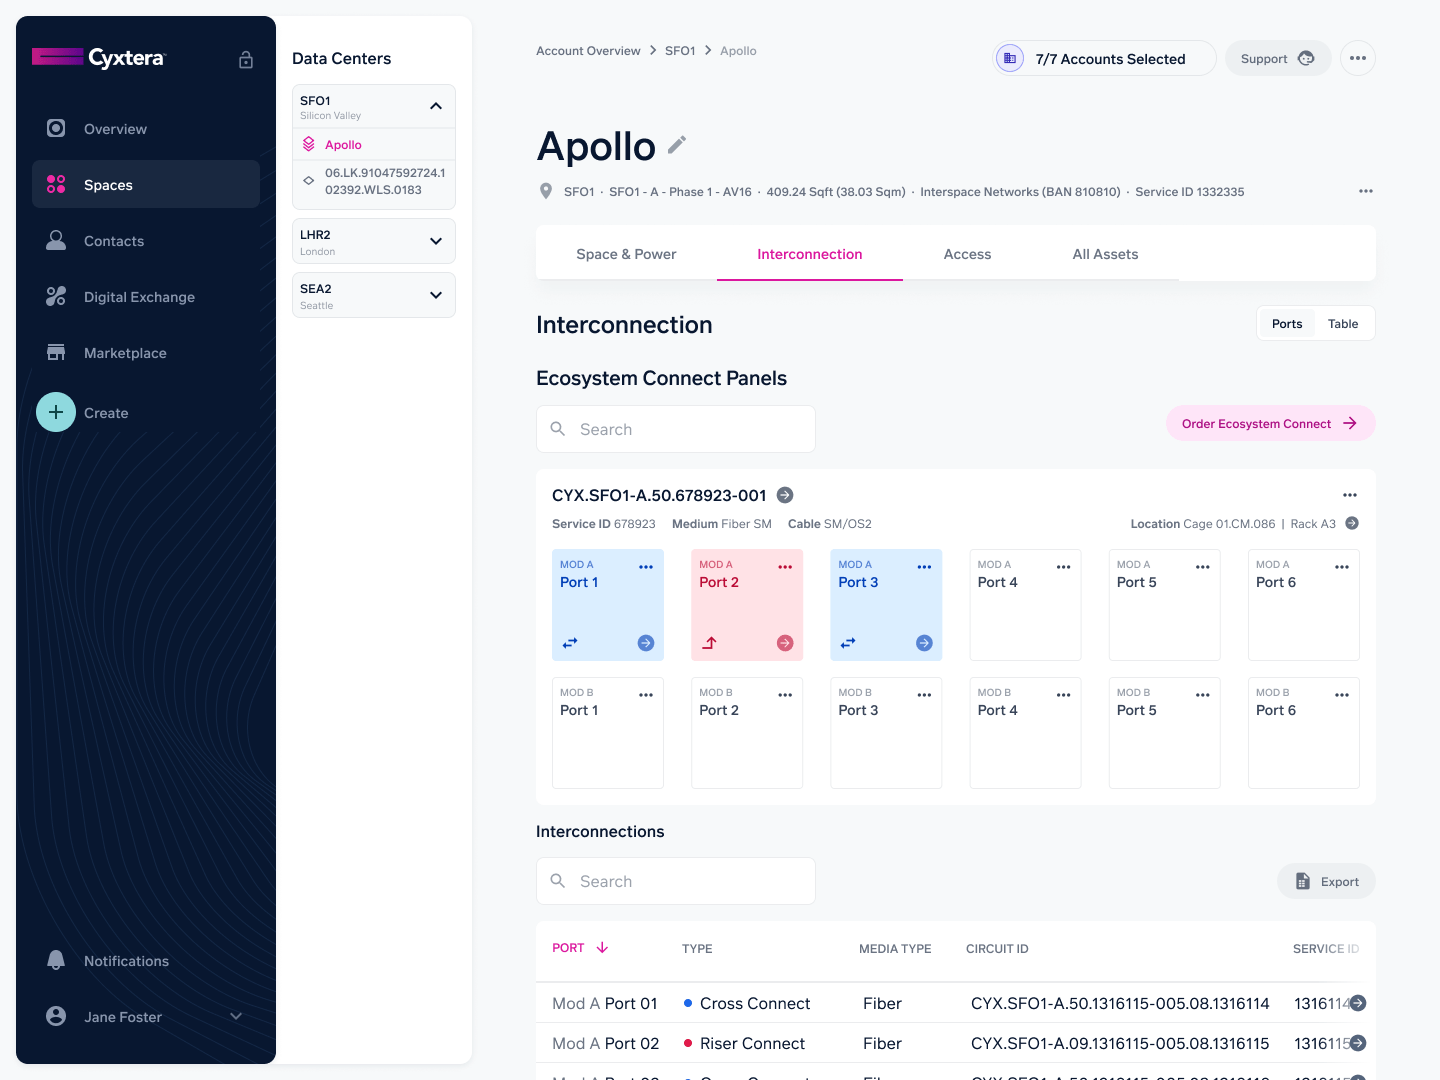
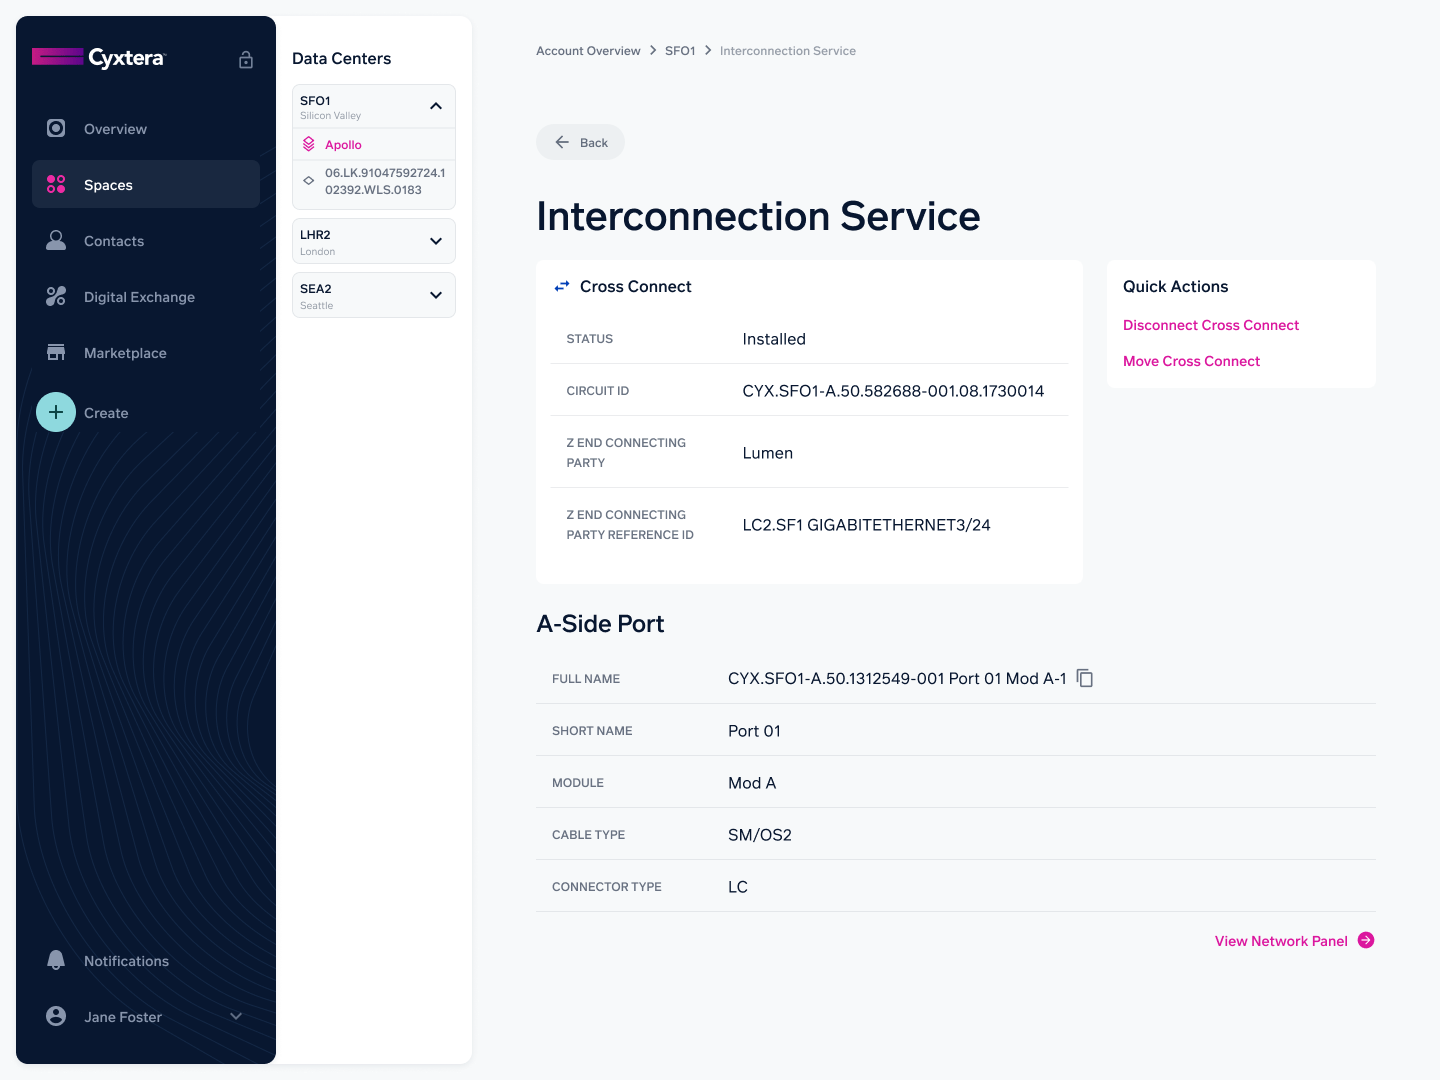
Choosing an interconnection from the table or a used port brings you to a page for that interconnection asset where you can view all the details for the service, see available actions such as move or disconnect, and view the network panel page for the A-side port.
Searching Assets
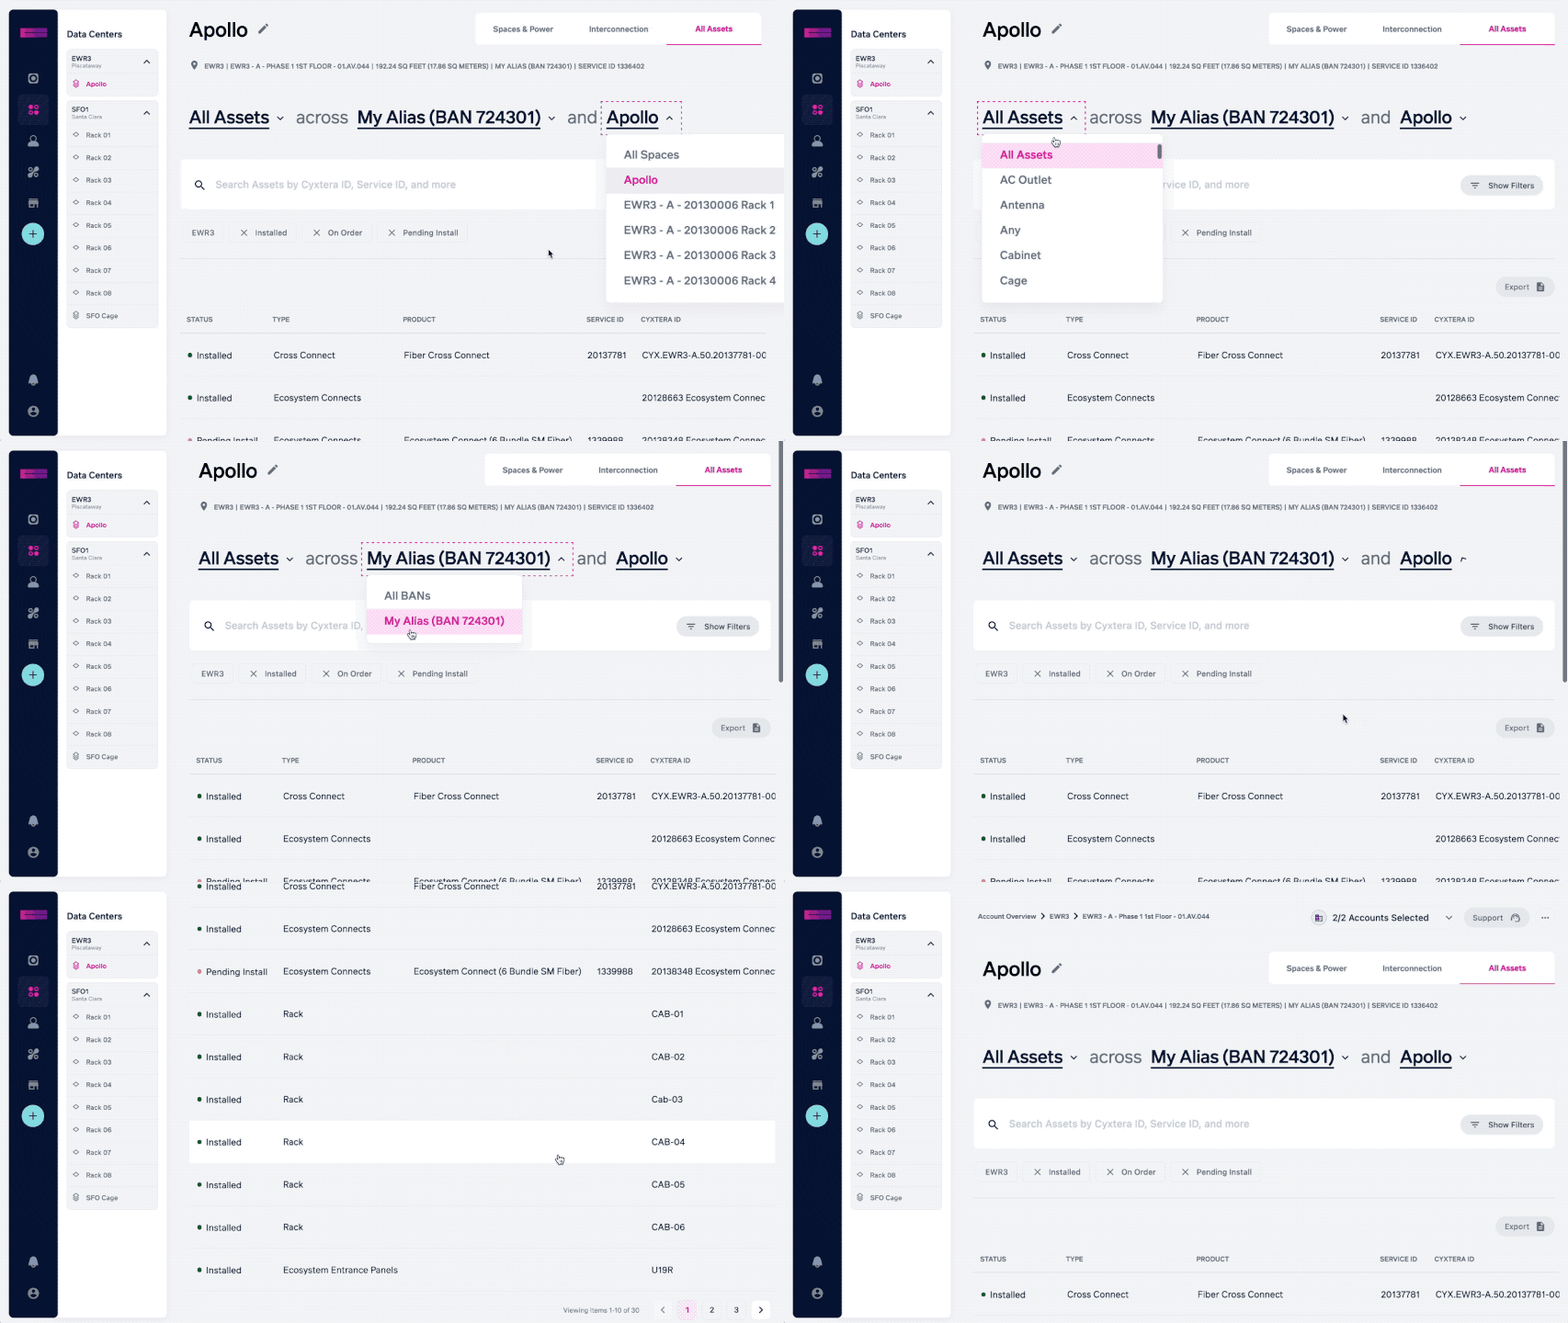
The final tab on a Space allows you to view all assets associated with that space. While initially this view is filtered to the space you are currently viewing, it is possible to adjust the filters to see assets on any of your BANs, in any space. This allows you to easily see a report of all the assets on a given billing account.
Updated about 1 year ago