Rack and Circuit Power Graphs, Tickets filters, and more
In the latest release of Cyxtera Portal, you can now view power graphs of standalone racks, just as you can for cages, in addition to per-circuit power data breakdowns. We've also added the ability to filter tickets on your Account Overview and data center dashboard to find the exact remote hands or support case ticket you are looking for. Finally, we've sped up the loading of individual cages and now allow you to add attachments during the creation of a ticket.
Rack and Power circuit graphs
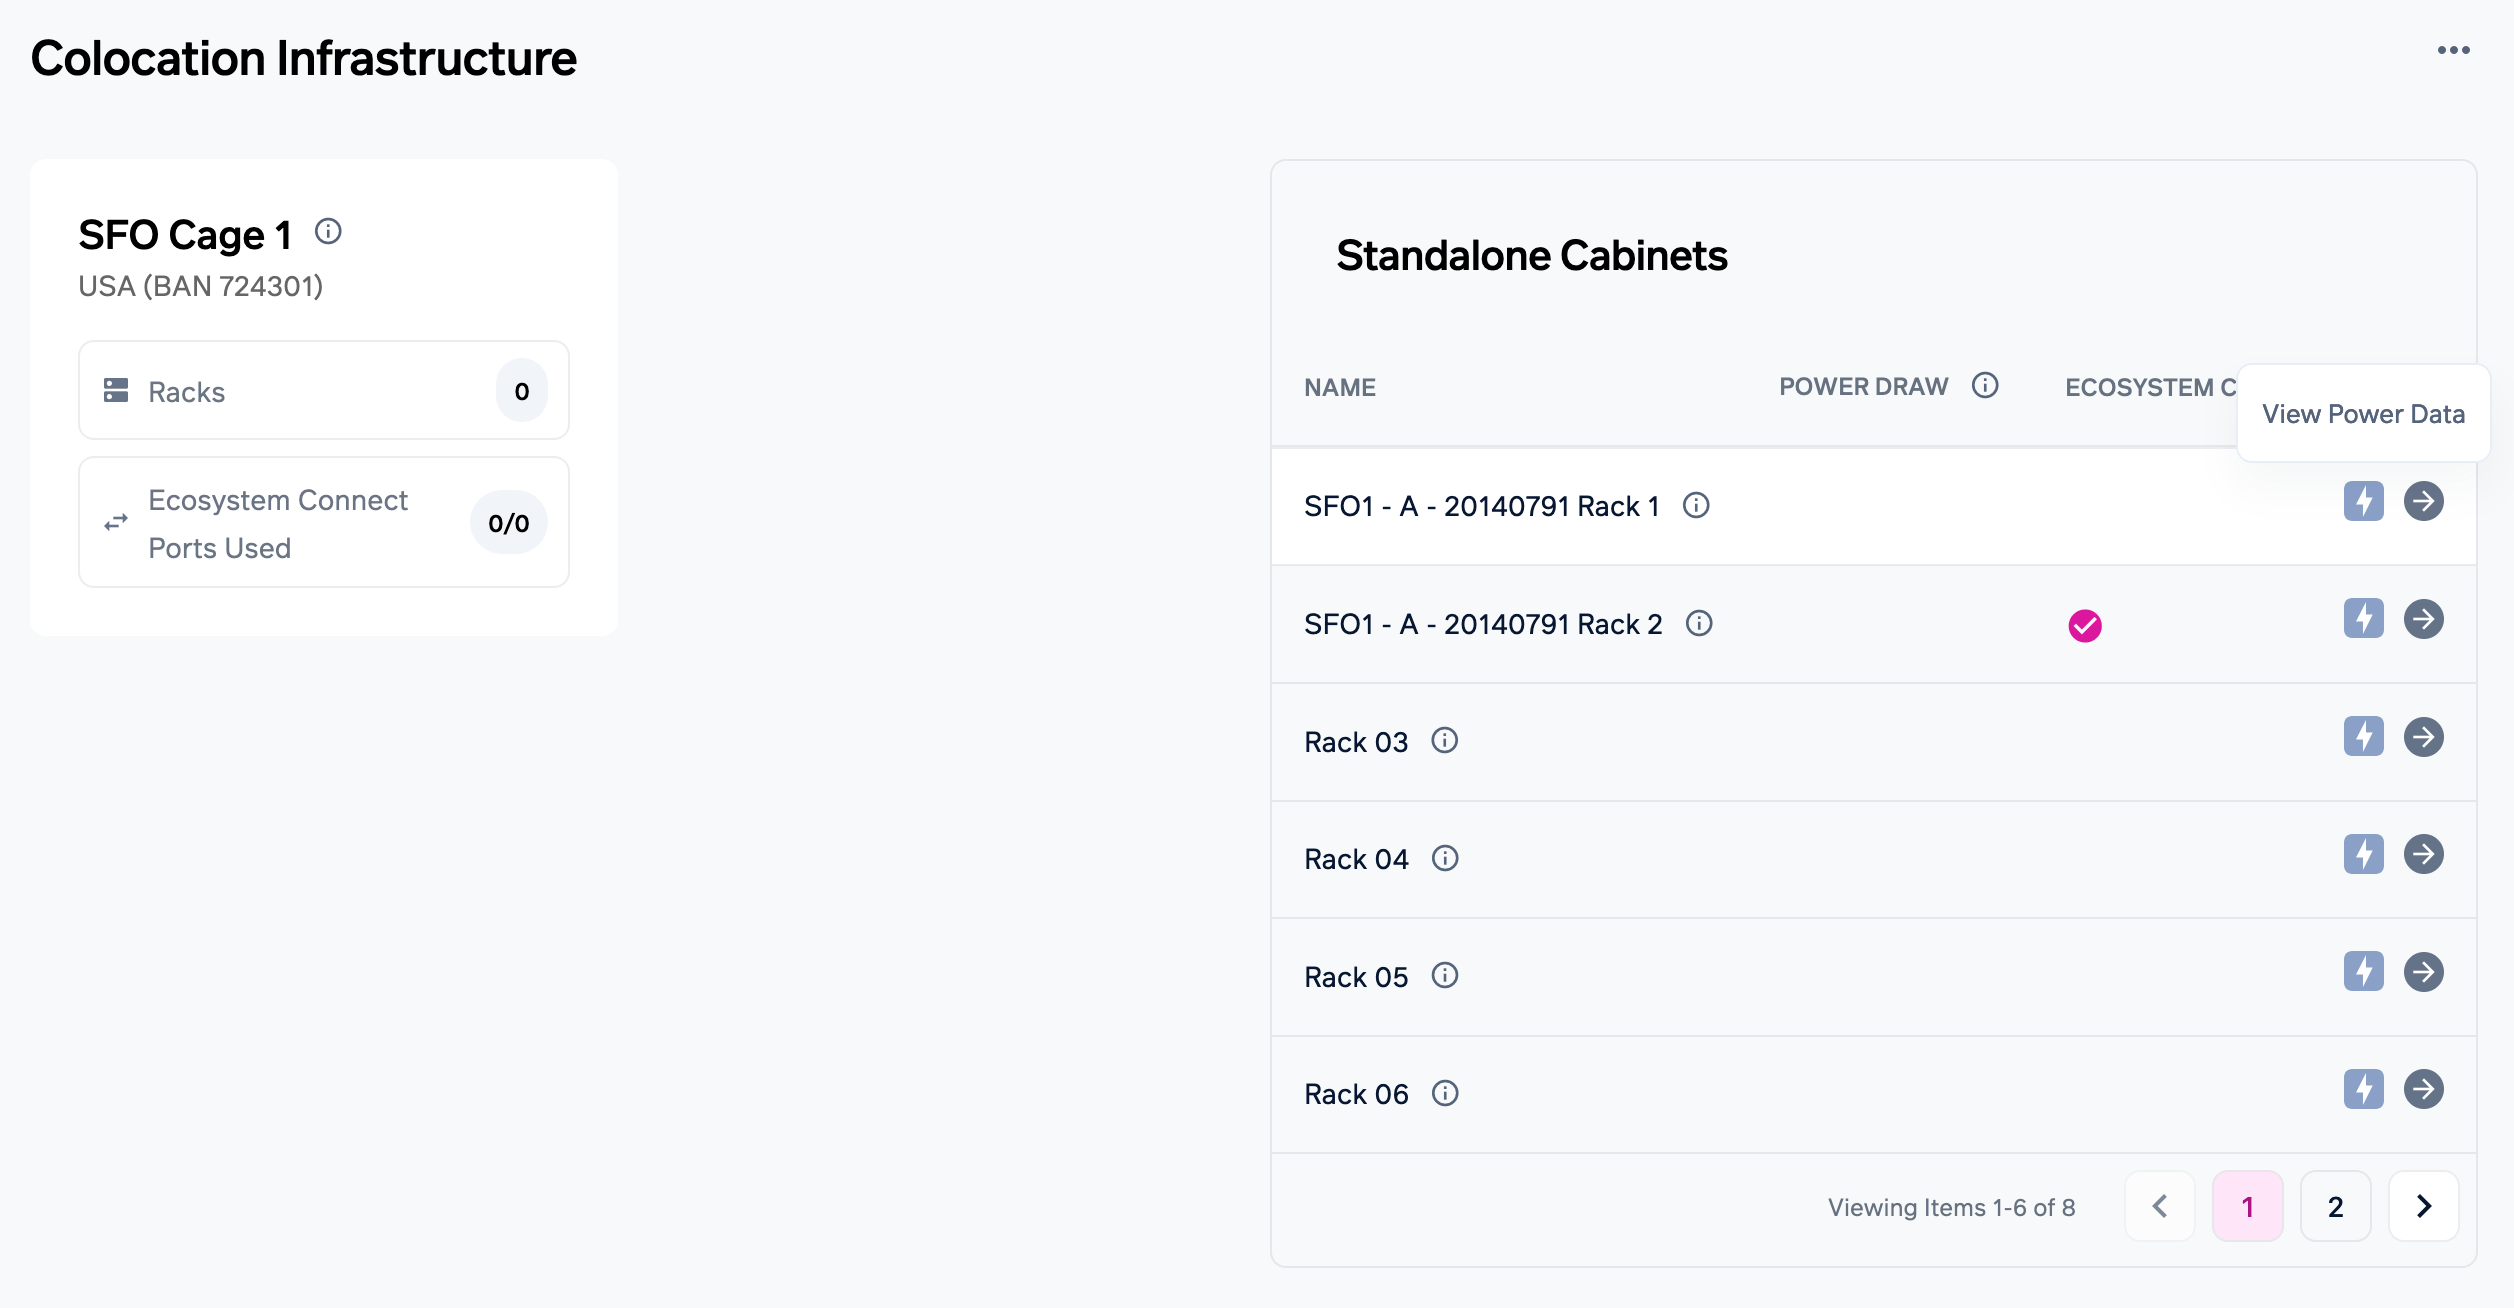
When viewing a data center dashboard, we display any cages as well as standalone, secure cabinets in the "Colocation Infrastructure" section. From here, you can now view historical data for each standalone cabinet by selecting the lightning bolt button on any cabinet's row.

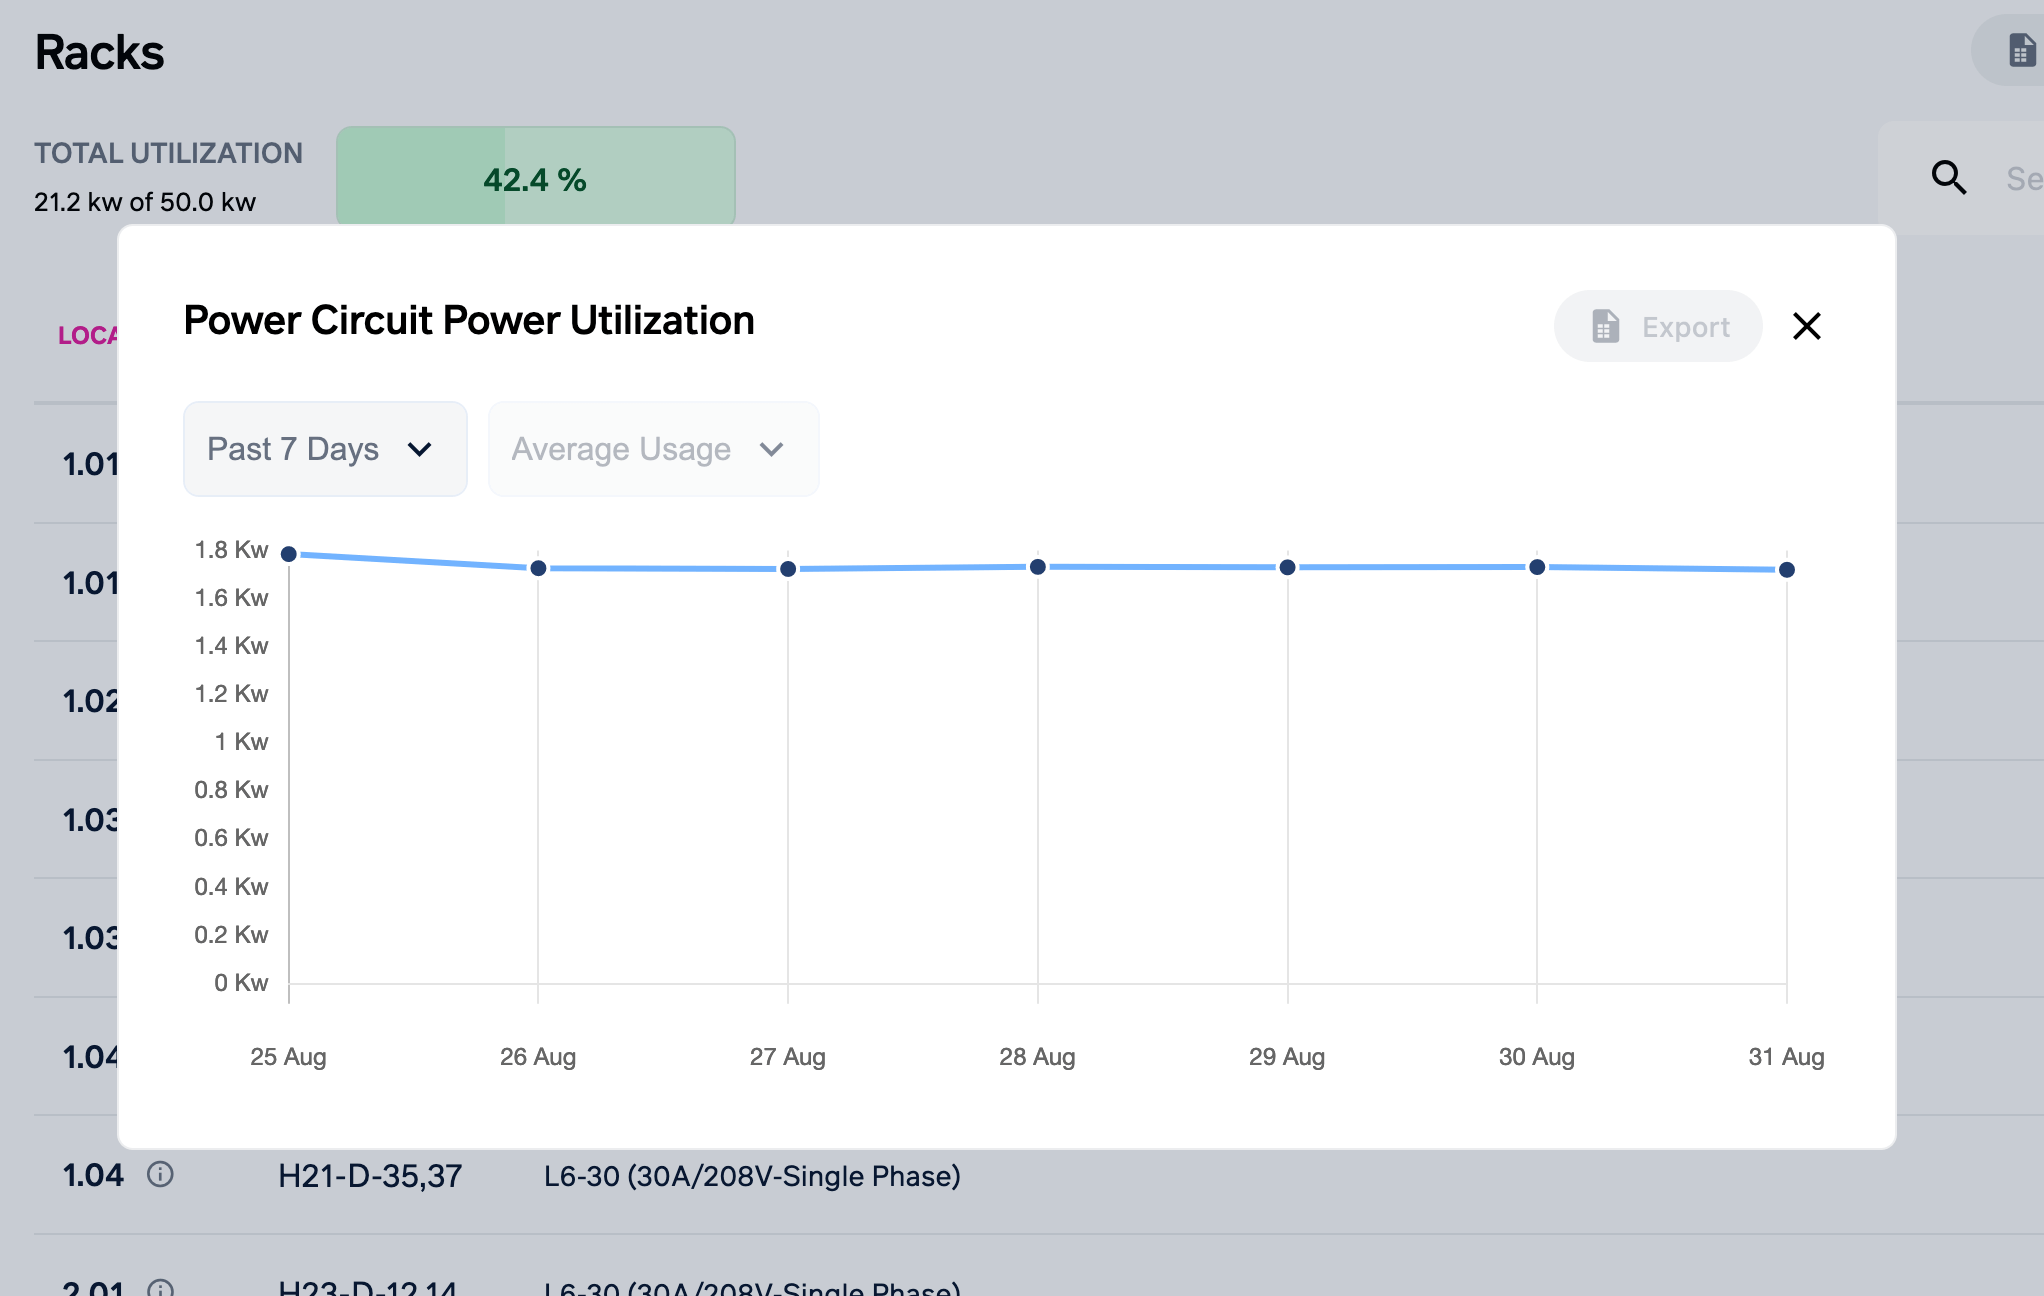
From your Space, select the "Power" view indicator to view all the power circuits as a table. Here, you'll find a button on each power circuit to view power data at the end of each row.

When selected, the historical power data for that circuit will be shown. The past 7 days or last calendar month can be toggled for display.

Tickets filters
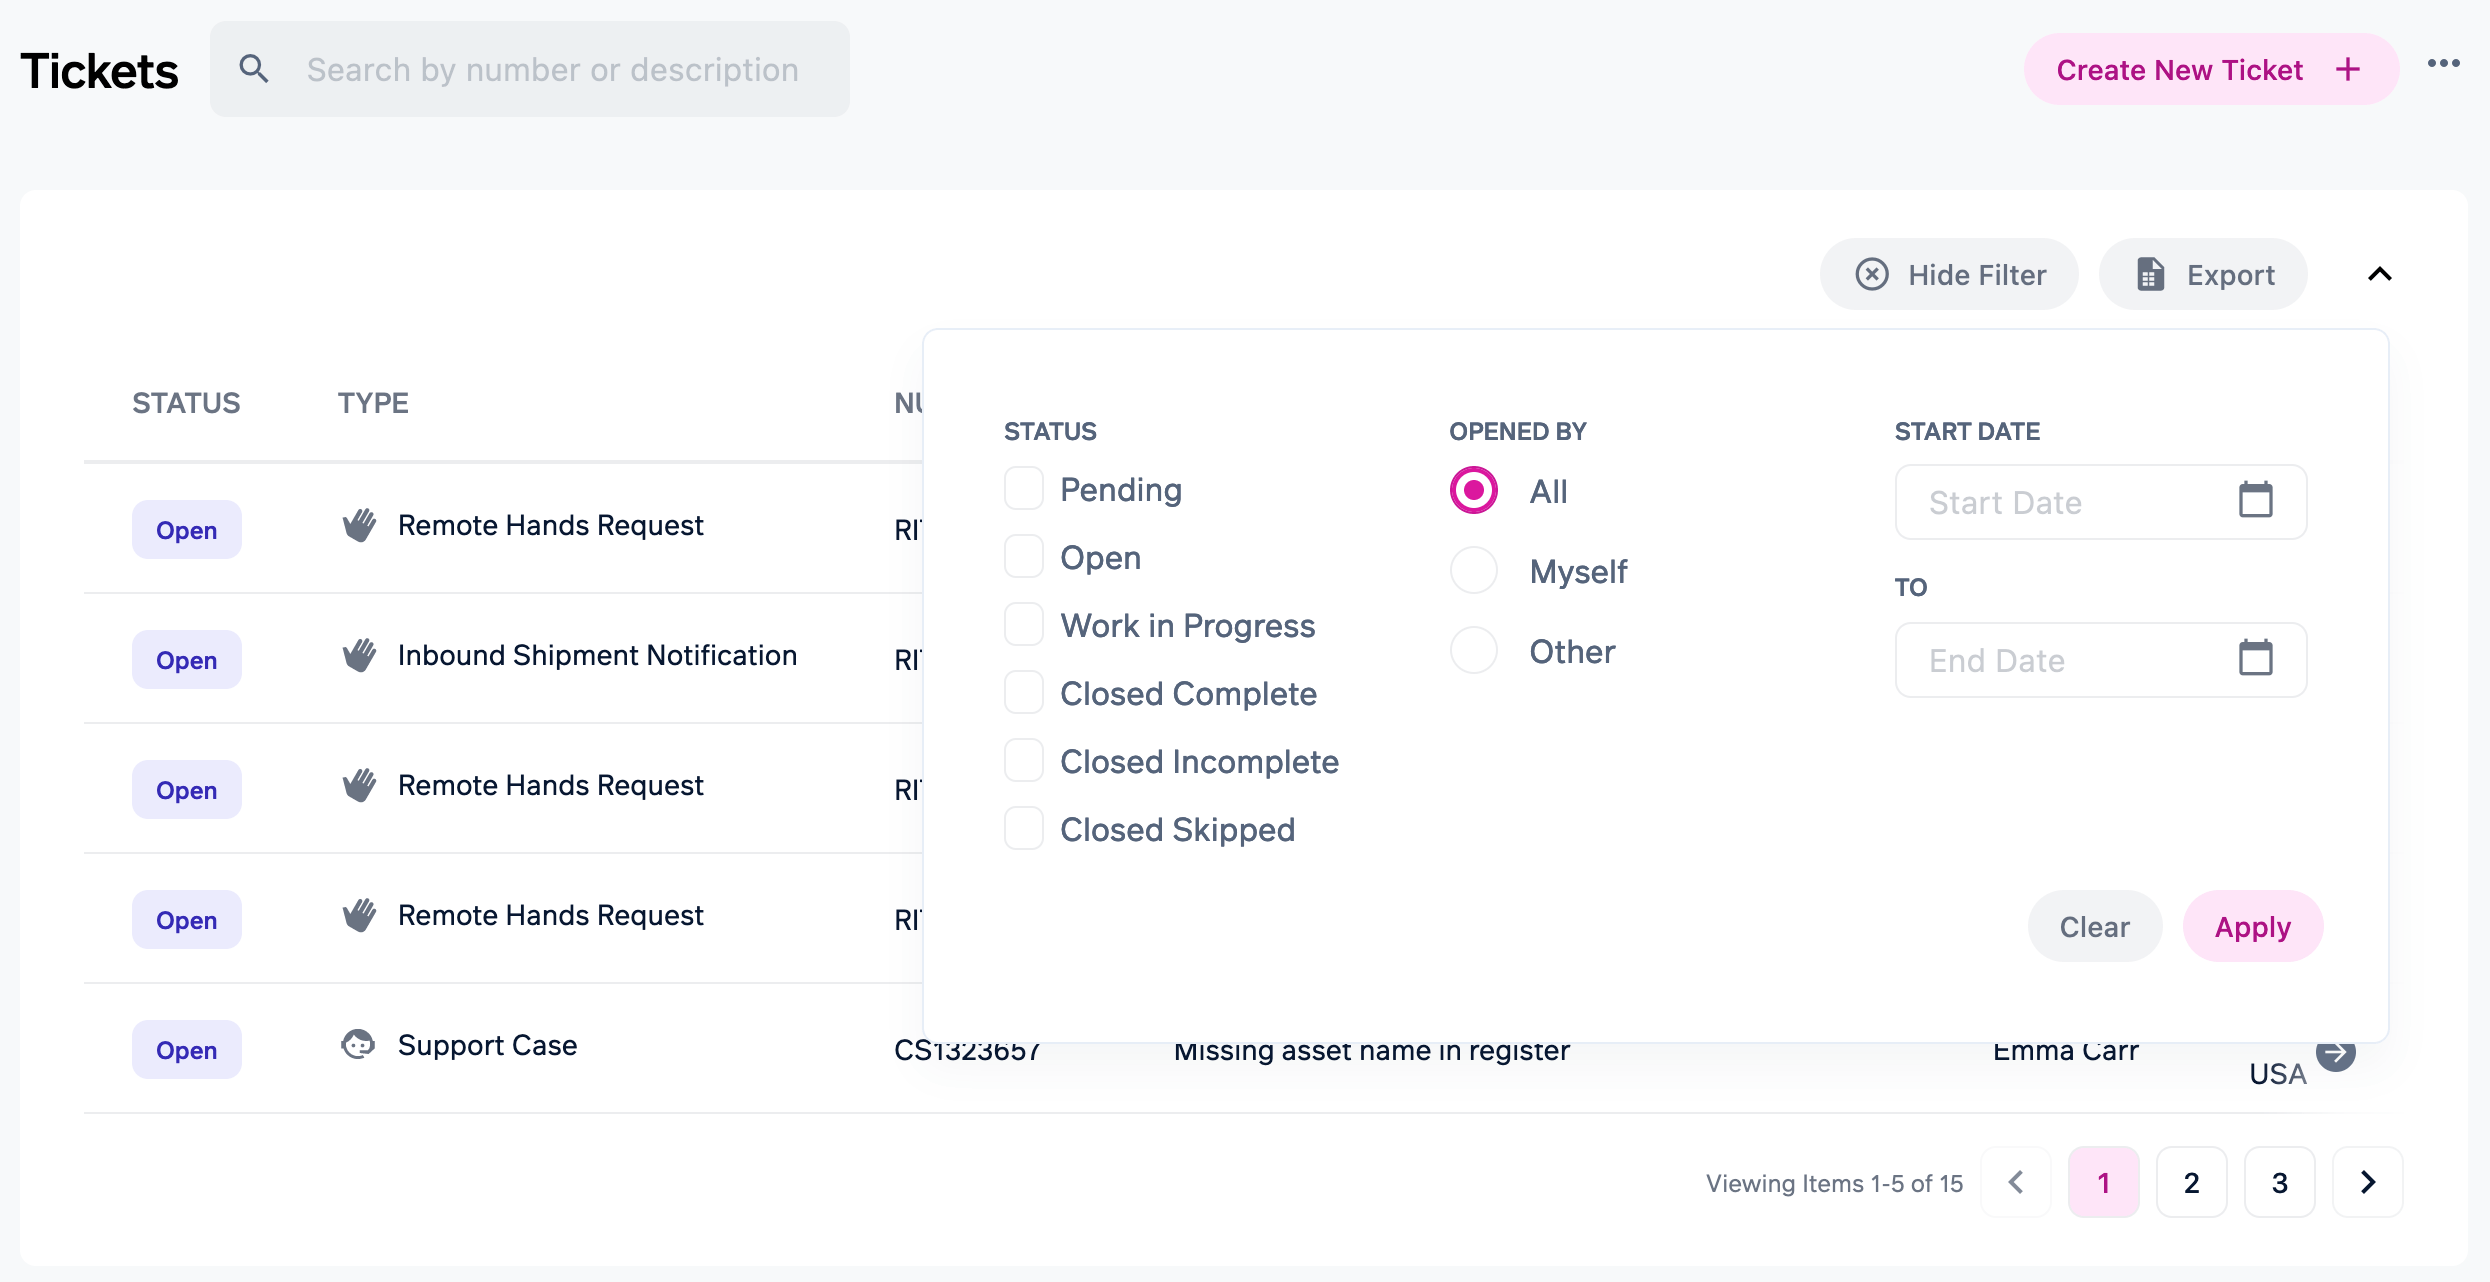
Finding the exact ticket you want on the portal has never been easier. Now you can select "Show Filters" from the Tickets widget on the Account Overview to be presented with a powerful set of filters. Tickets may be filtered by status, contact opened by, and by a date range for their creation.

Attachments during ticket creation
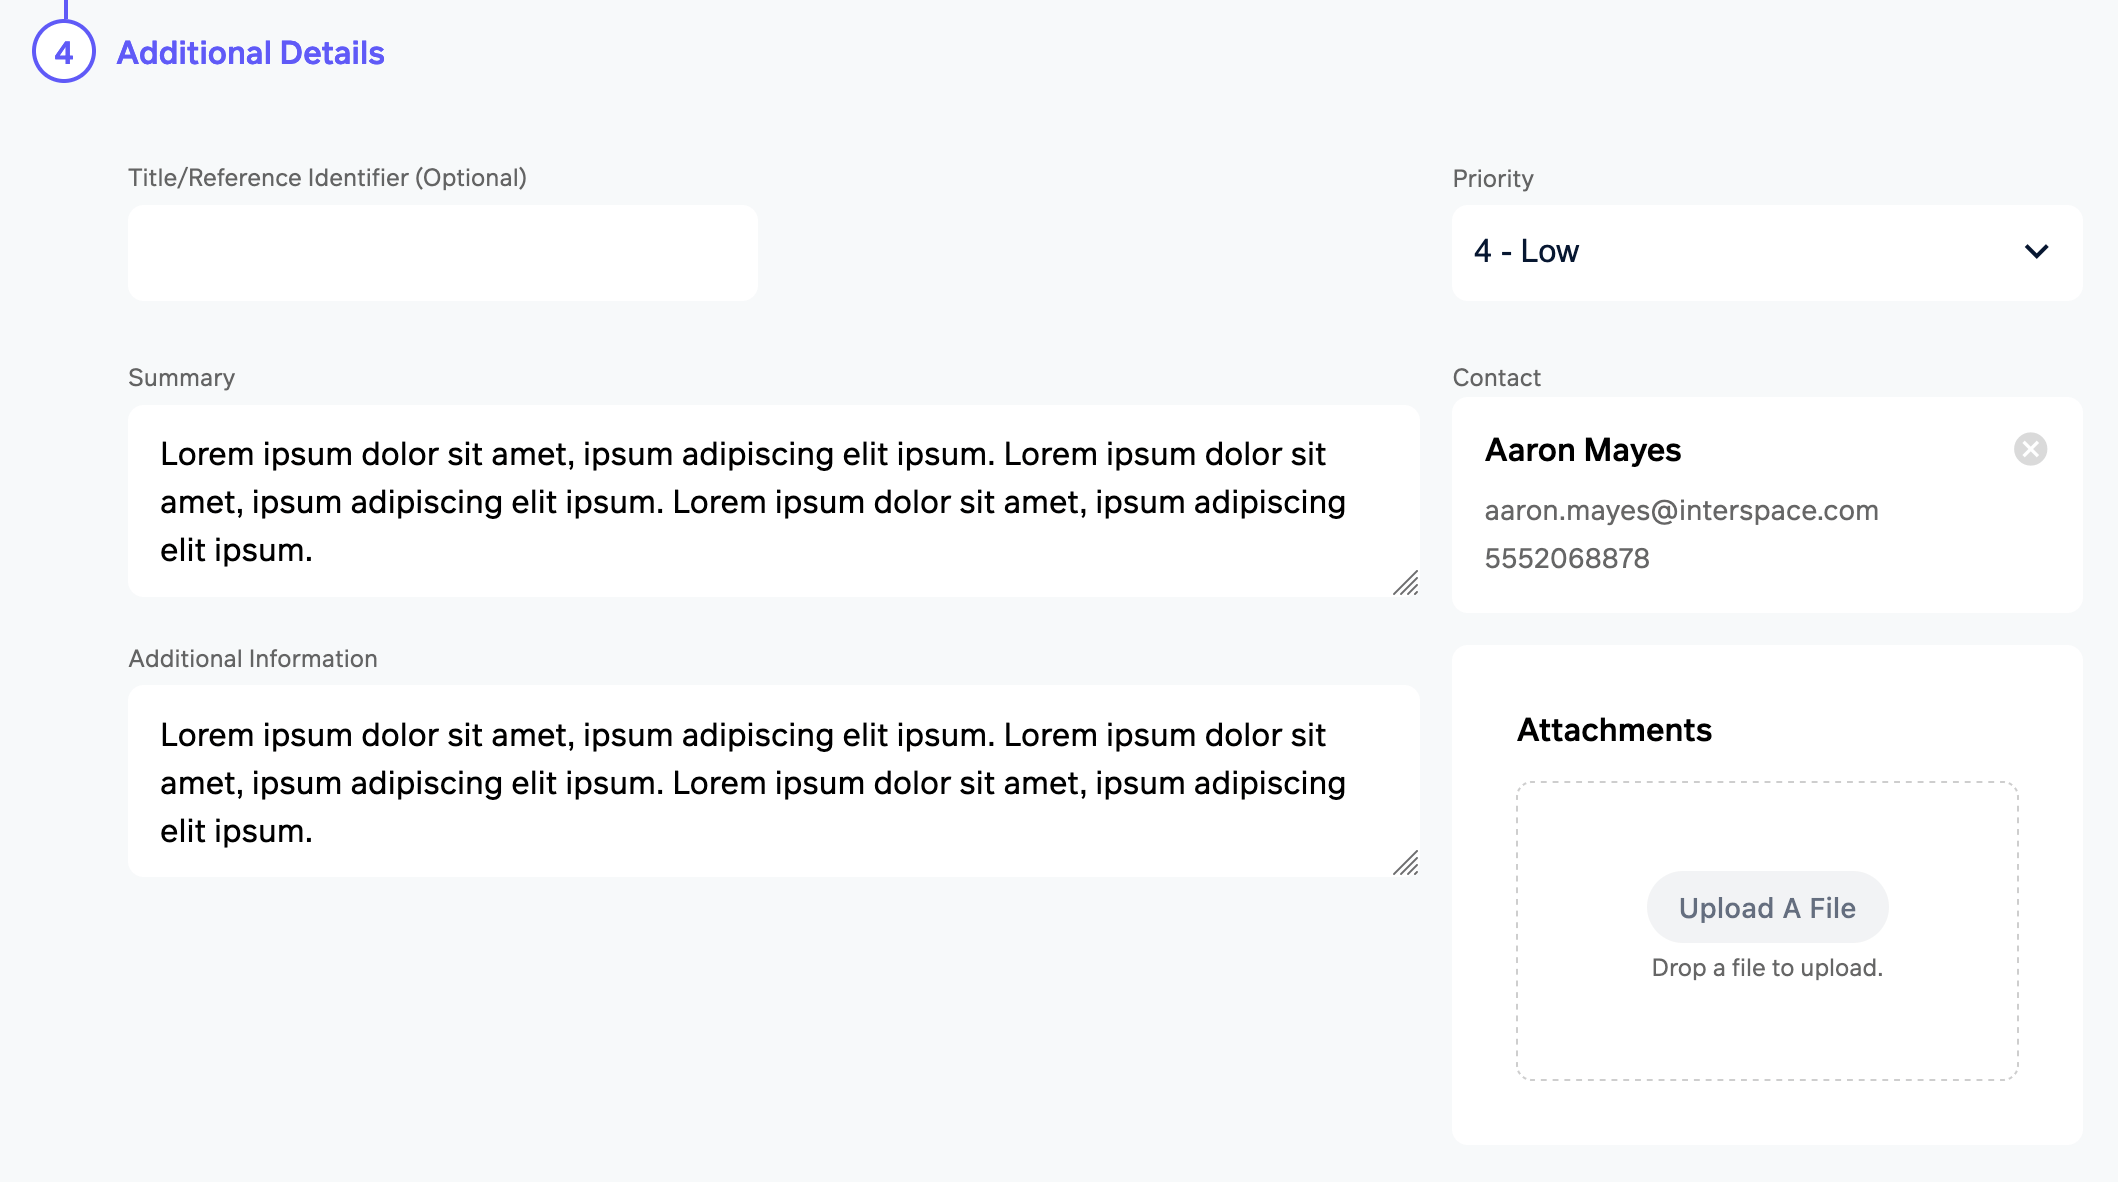
During the process of creating a Support or Remote Hands ticket, it is now possible to add an attachment to the ticket before it has been created. This allows you to add a screenshot to a support case or a schematic to a remote hands request without having to submit the ticket and then add the attachment as a second step.
